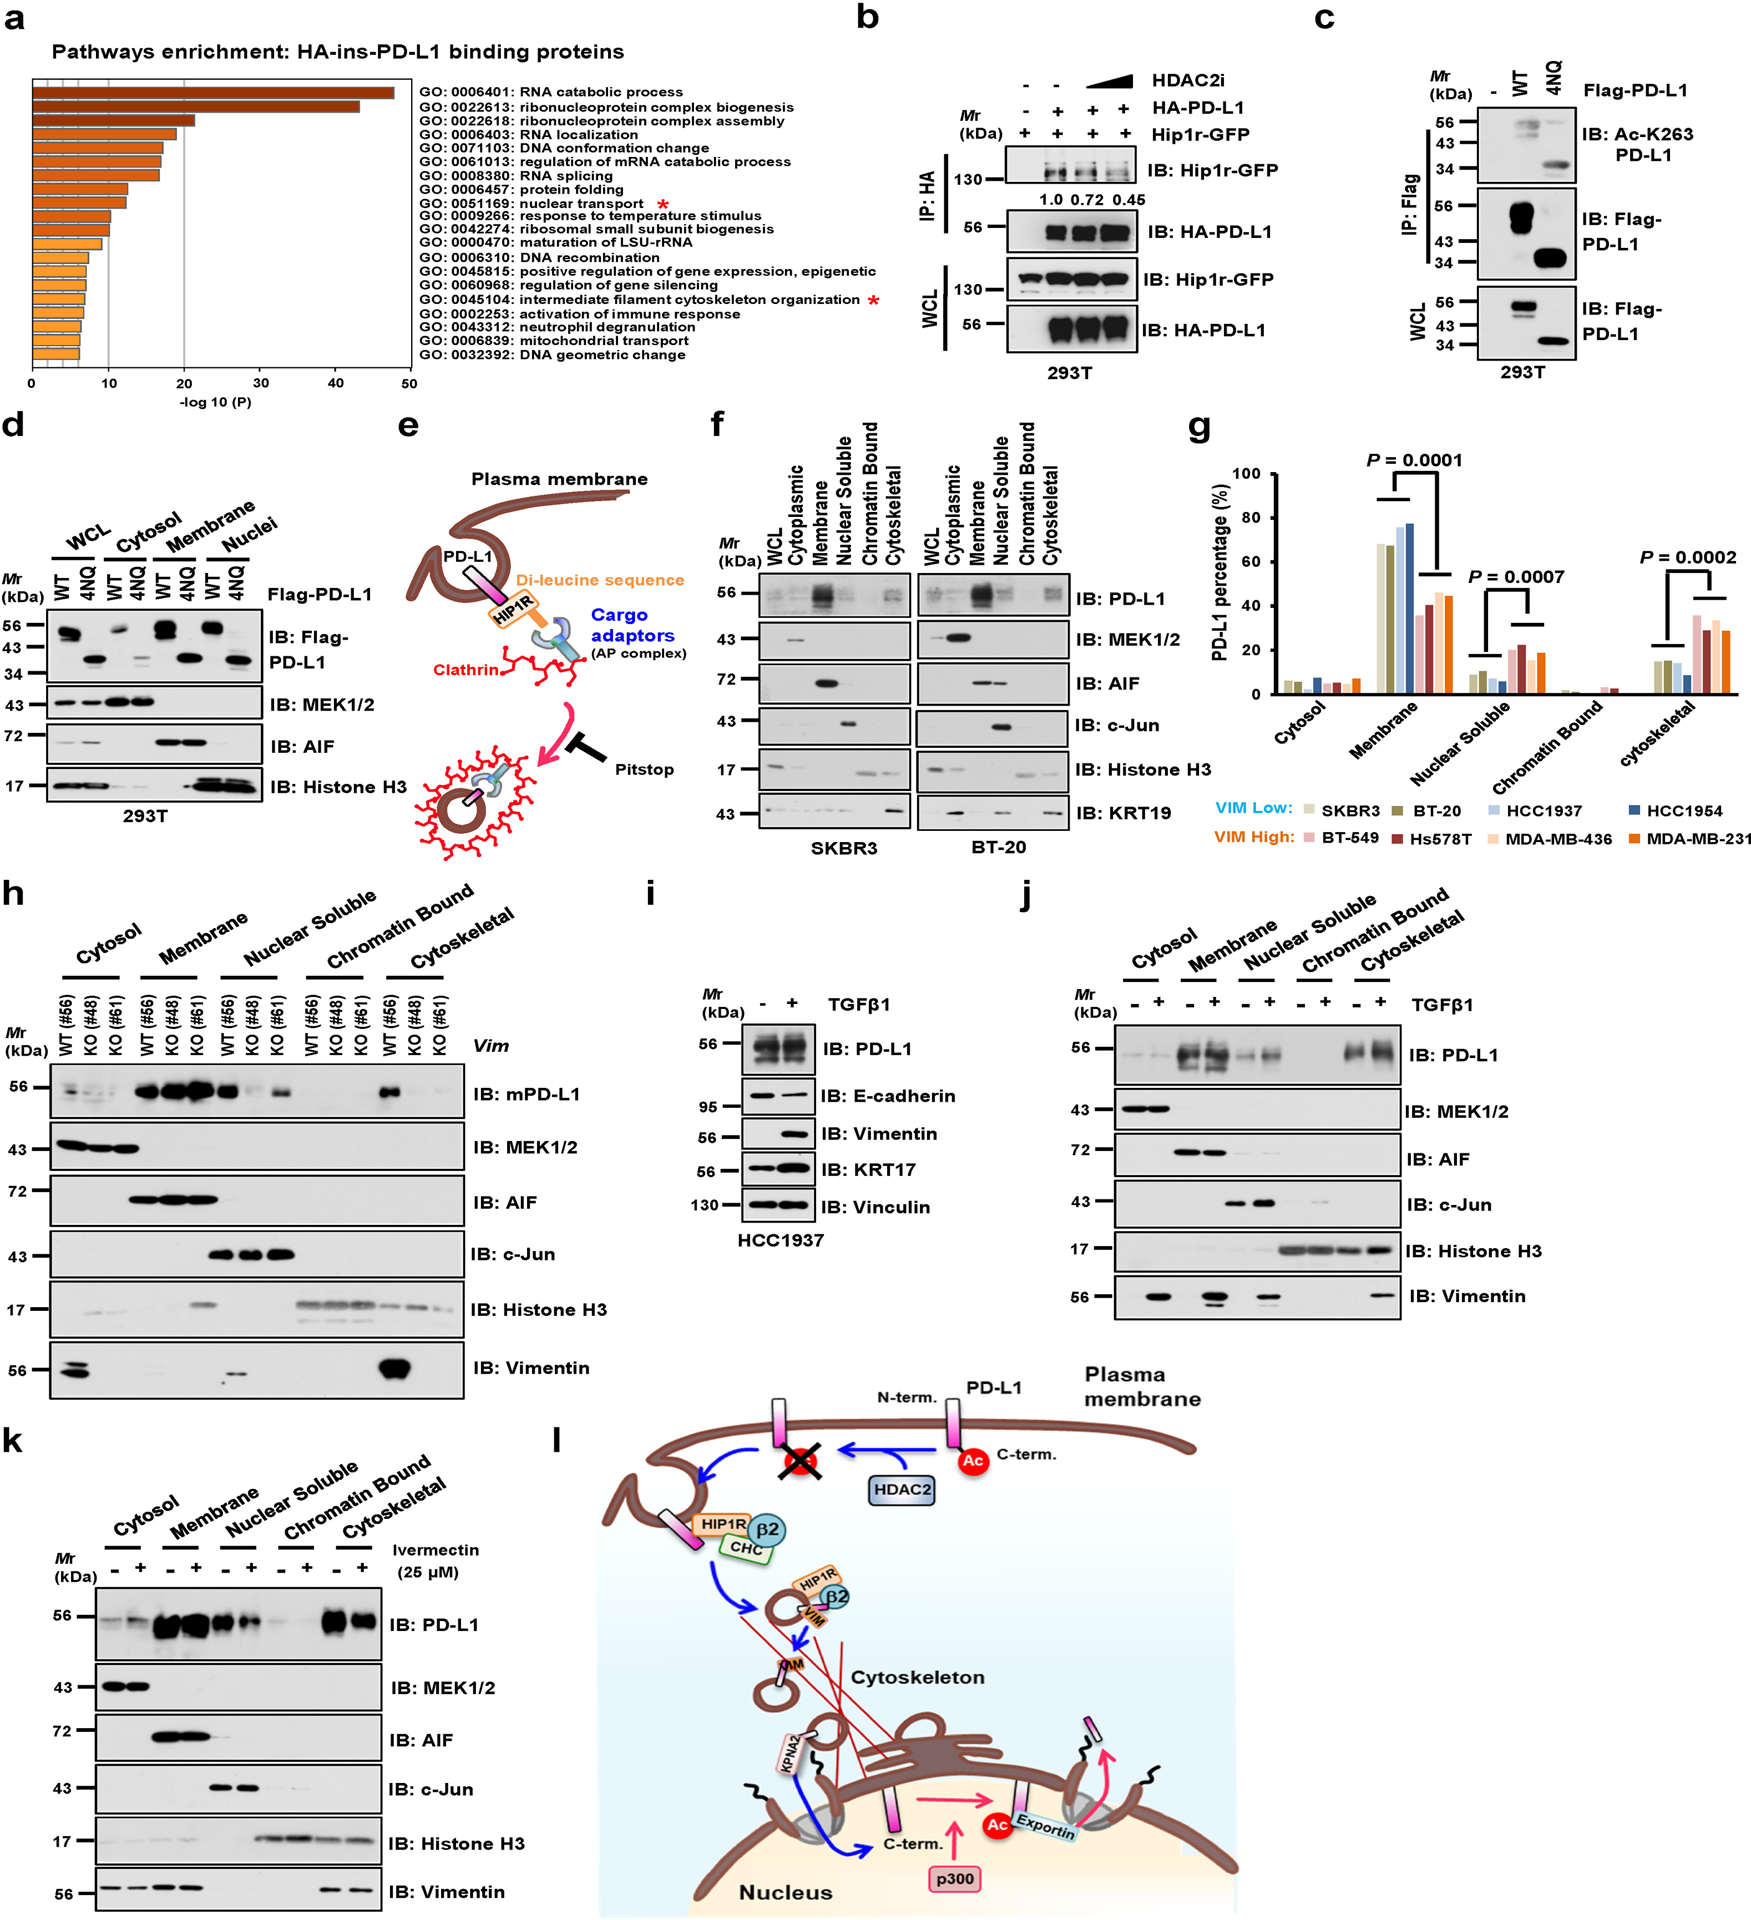
Extended Data Fig. 4. Protein interacting network likely mediates PD-L1 nuclear translocation process.

a, Results from mass spectrometry analysis were analyzed for GO term enrichment. Red stars denote pathways associated with protein translocation. n = 2 independent experiments with similar results. P values were calculated using hypergeometric test. b, IB of WCL and anti-HA IPs derived from 293T cells transfected with HA-ins-PD-L1 and mouse Hip1r-GFP, and treated with HDAC2 inhibitor for 6 hrs. c, IB of WCL and anti-Flag IPs derived from 293T cells transfected with PD-L1 WT or glycosylation-deficient 4NQ (N35, N192, N200 and N219) mutant. d, Fractionation analysis for PD-L1 from 293T cells transfected with WT or the glycosylation-deficient 4NQ mutant. e, Schematic diagram depicting the working model for endocytosis of PD-L1 from plasma membrane. f, Fractionation analysis for PD-L1 in Vimentin-low SKBR3 and BT-20 cells. g, Relative abundance of PD-L1 protein in each fraction was quantified and calculated for percentage. Statistics, two-tailed Student’s t-test. h, Fractionation analysis for PD-L1 in CT26 WT and Vim KO clones. i, IB of HCC1937 cells treated with 10 ng/ml Transforming Growth Factor-β1 (TGFβ1) for 14 days. j, Fractionation analysis for PD-L1 in HCC1937 cells treated with 10 ng/ml TGFβ1 for 14 days. k, Fractionation analysis for PD-L1 in MDA-MB-231 cells treated with vehicle or 25 μM Ivermectin (IVM) for 2 hrs. l, A schematic diagram to show the working model for nuclear translocation of PD-L1 from plasma membrane. Western blots in b-d, f, and h-k were performed for n=2 independent experiments with similar results. Unprocessed immunoblots are shown in Source Data Extended Data Fig. 4. Statistical source data are available in Statistical Source Data Extended Data Fig. 4.
