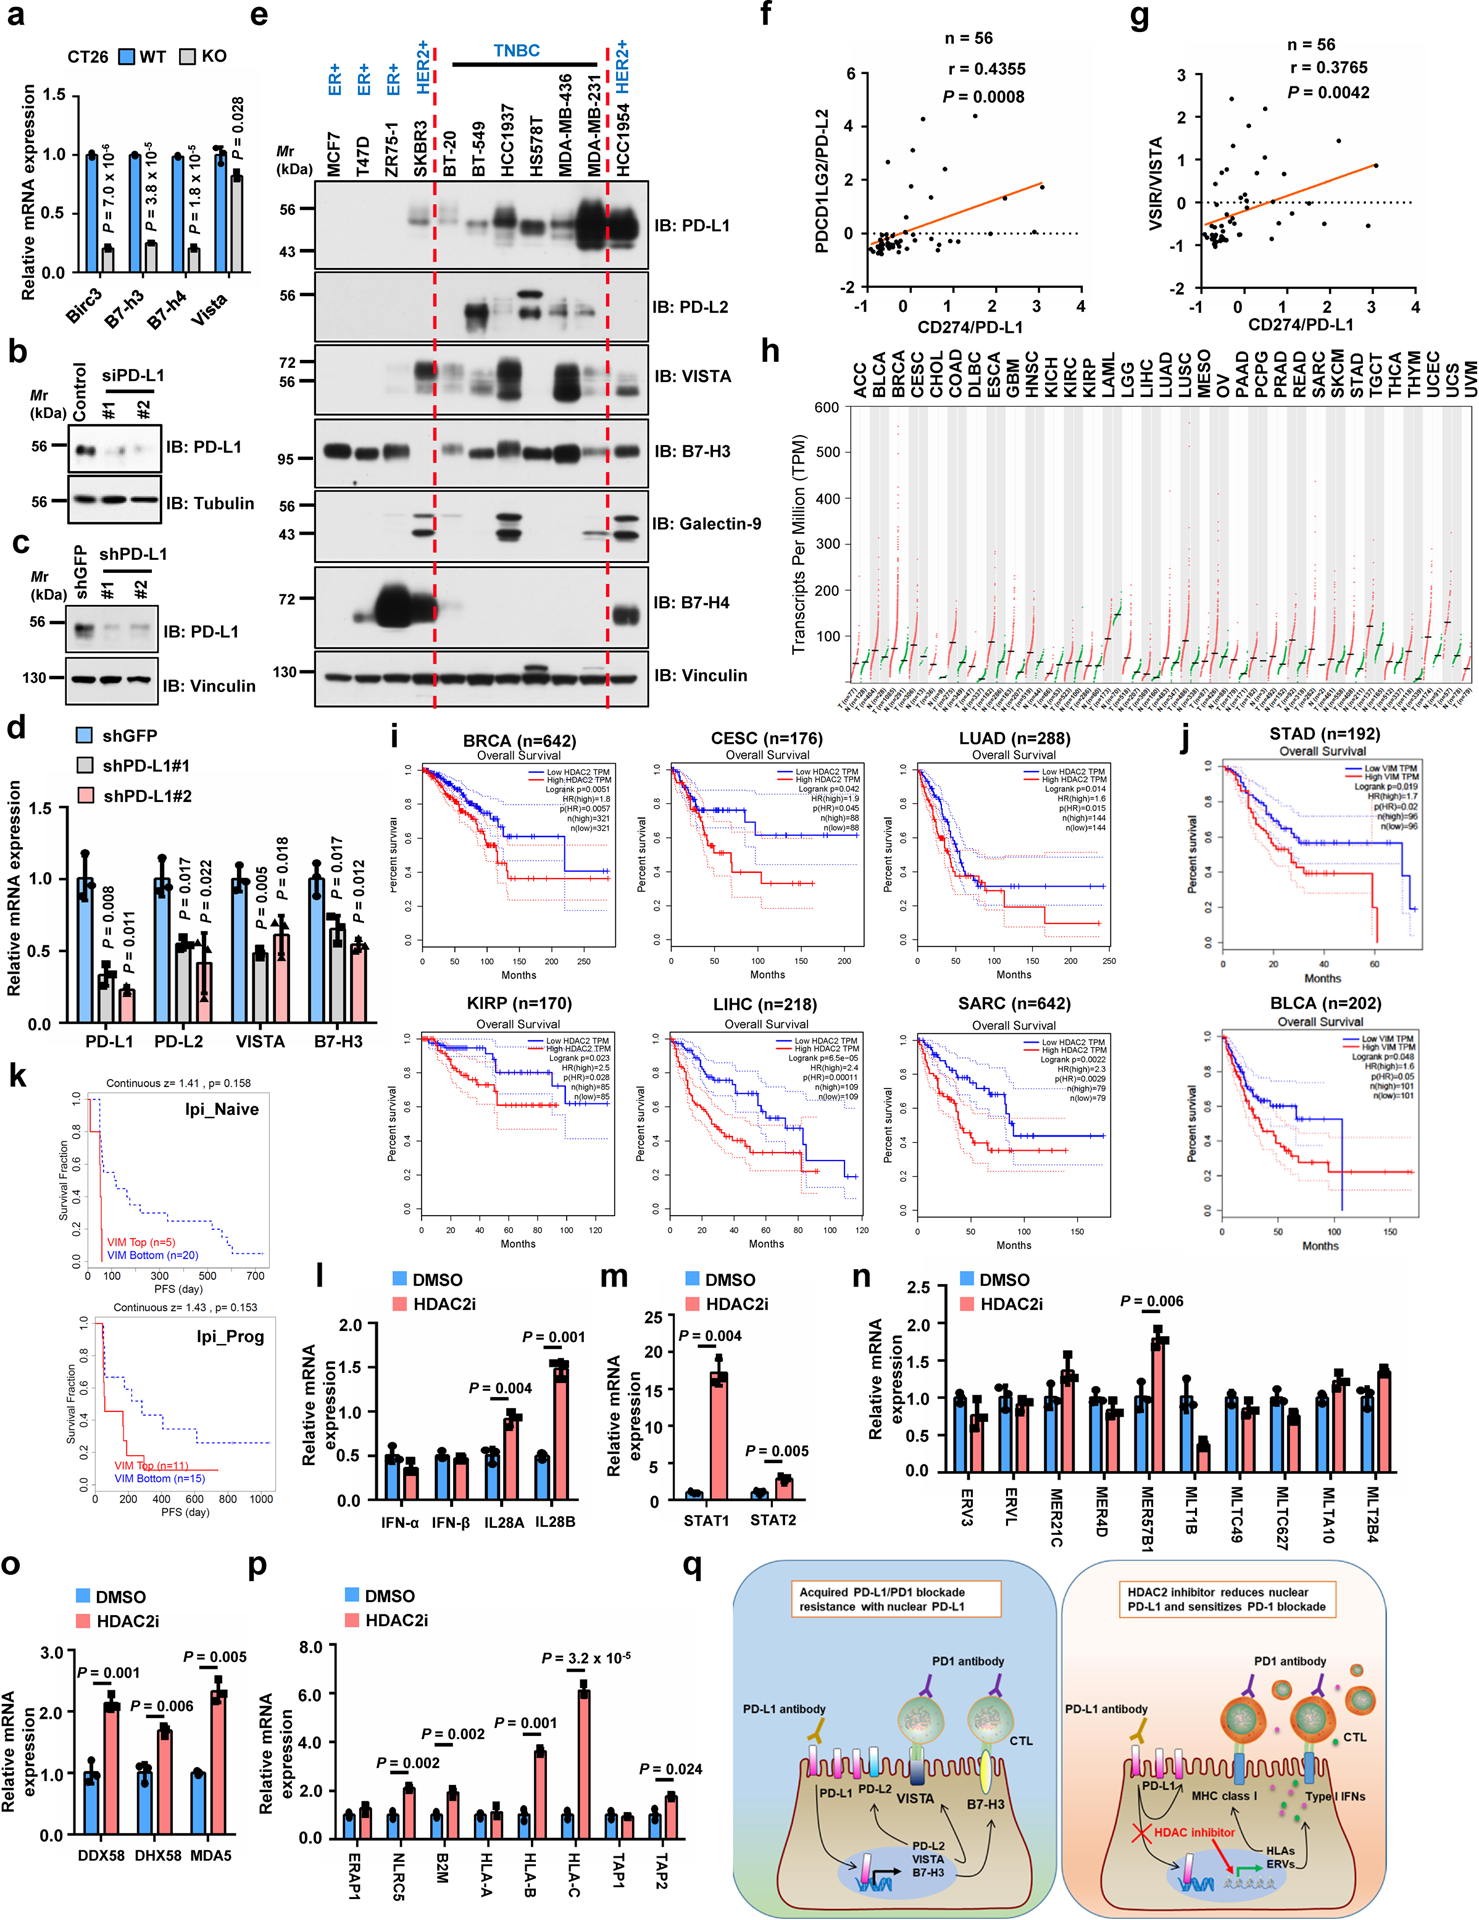
Extended Data Fig. 6. PD-L1 expression levels correlate with and regulate immune-checkpoint genes.

a, qRT-PCR analysis of genes upon Pd-l1 KO in CT26 cells. b, IB of MDA-MB-231 cells transfected with control or PD-L1 siRNAs. c, d, IB (c) and qRT-PCR (d) analysis of MDA-MB-231 cells with PD-L1 knockdown by shRNAs. e, IB of WCL derived from breast cancer cell lines. f, g, Pearson correlation (two-tailed) analysis for PD-L1 mRNA (Z-score) with PD-L2 (f) or VISTA (g) in breast cancer cell lines (GSE36139). Red line, linear regression line. h, HDAC2 expression profiled by GEPIA. Tumour (T), red dots; normal tissues (N), green dots. i, Overall survival of patients with high (>70%, red curve) and low (<30%, blue curve) HDAC2 (i) or Vimentin (j) analyzed using Log-rank test by GEPIA. k, Progression-free survival (PFS) of melanoma patients (Riaz2017_PD1 cohort, PMID:29033130) treated with PD-1 mAb (Nivolumab) with high or low VIM expression analyzed using Kaplan-Meier curves by TIDE. Ipi_Naive, ipilimumab-naïve (n=25); Ipi_Prog, progressed on ipilimumab (n=26). l-p, qRT-PCR of MDA-MB-231 cells treated with vehicle or HDAC2 inhibitor. These genes are involved in Type I or III interferon pathways (l), STAT1/2 pathways (m), endogenous retrovirus ERVs (n), double-stranded pattern recognition receptors (o), antigen presenting and presentation via MHC class I (p). q, Schematic diagram to show a possible molecular mechanism of acquired PD-L1/PD-1 blockade resistance caused by nuclear PD-L1 (left), and the potential usage of HDAC2 inhibitor (right). Tumor abbreviations are shown in GEPIA. Western blots b-c and e were performed for n=2 independent experiments with similar results. PCR data a, d and l-p were shown as mean ± s.d. of n=3 independent experiments, analyzed by two-tailed Student’s t-test. Unprocessed immunoblots are shown in Source Data Extended Data Fig. 6. Statistical source data are available in Statistical Source Data Extended Data Fig. 6.
