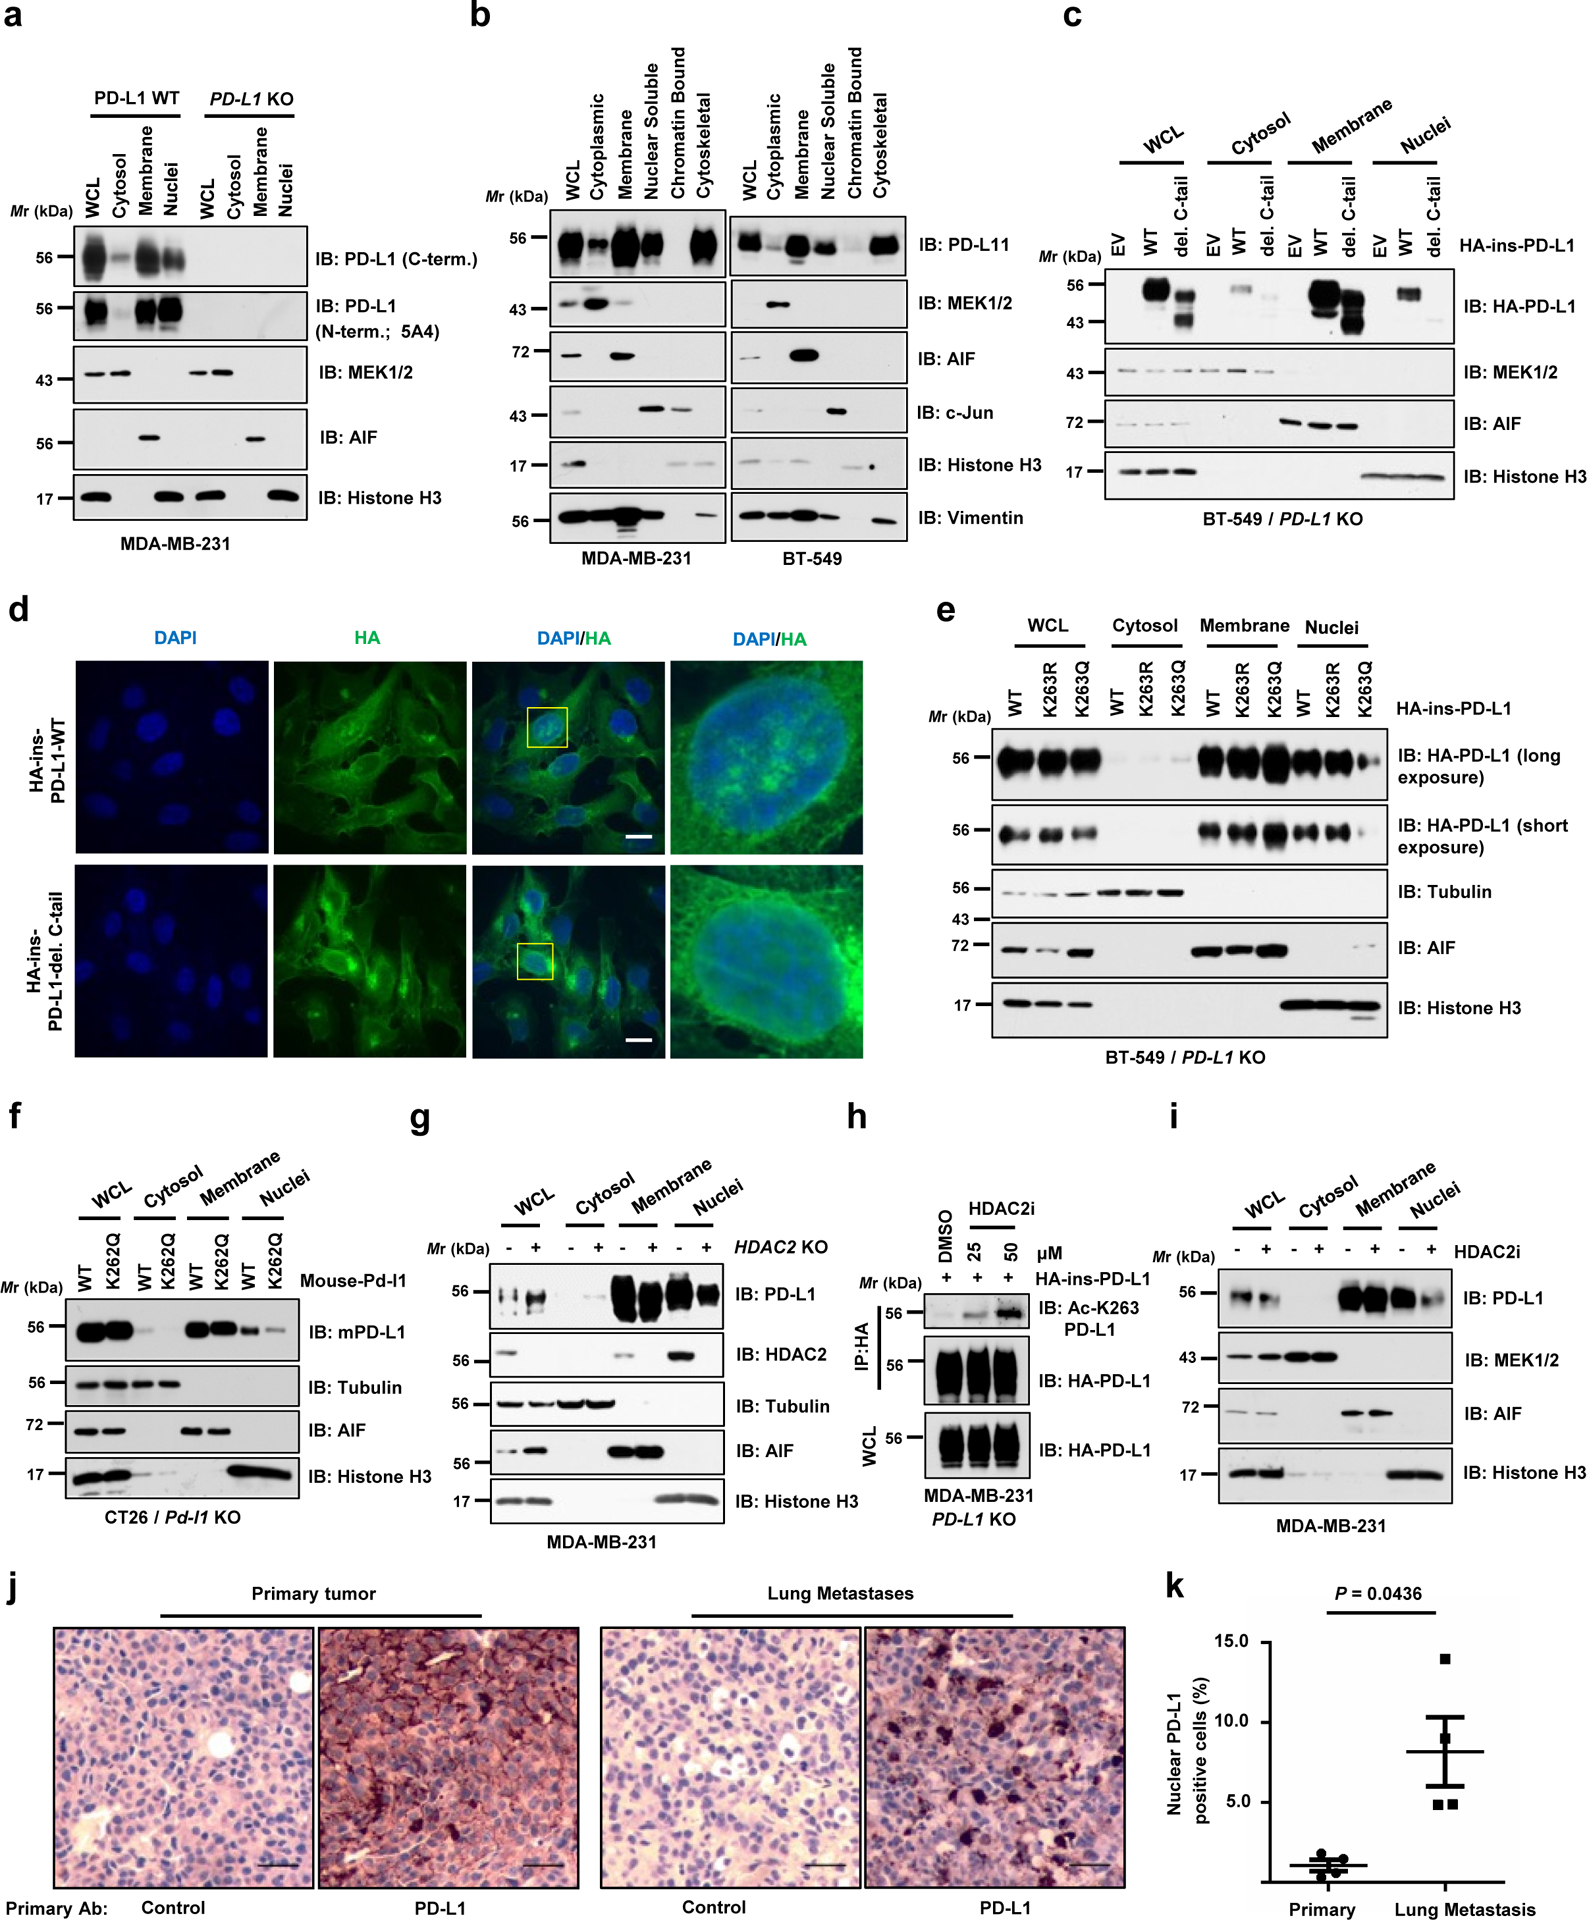
Figure 3 |. Nuclear translocation of PD-L1 is regulated by K263 acetylation.

a. IB analysis of WCL, cytosol, membrane, and nuclear fractions derived from MDA-MB-231 WT or PD-L1 KO cells, purified using a Cell Signaling Technology kit. b. IB analysis of WCL, cytoplasmic, membrane, nuclear soluble, chromatin bound and cytoskeletal fractions derived from MDA-MB-231 and BT-549 cells, purified using a Thermo Scientific kit. c. Fractionation analysis for PD-L1 in BT-549 PD-L1 KO cells transfected with HA-ins-PD-L1 WT or C-tail deletion (del. C-tail) mutant. d. Immunofluorescence (IF) with anti-HA antibody and DAPI staining of MDA-MB-231 PD-L1 KO cells transduced with HA-ins-PD-L1 WT or its del. C-tail mutant lentivirus. Scale bars, 10 μm; n=2 independent experiments were performed with similar results. e. Fractionation analysis for PD-L1 in BT-549 PD-L1 KO cells transfected with the indicated constructs. f. Fractionation analysis for WT mouse PD-L1 or K262Q (corresponding to K263Q for human PD-L1) mutant from CT26 Pd-l1 KO cells. g. IB analysis of WCL, cytosol, membrane, and nuclear fractions derived from MDA-MB-231 WT or HDAC2 KO cells. h. IB analysis of WCL and anti-HA IPs derived from MDA-MB-231 PD-L1 KO cells transduced with HA-ins-PD-L1 lentivirus. Resulting cells were treated with DMSO or indicated concentration of the HDAC2 inhibitor (HDAC2i) for 4 hrs. i. Fractionation analysis for PD-L1 in MDA-MB-231 cells treated with 50 μM HDAC2 inhibitor for 6 hrs. j. Immunohistochemistry (IHC) analysis of mouse PD-L1 expression and localization in B16F10 primary tumours (subcutaneous injection) and lung metastases (tail vein injection). Scale bars, 50 μm, 20x magnification. k. Quantification of PD-L1 nuclear positive cell rates in j. Data represent the mean ± s.e.m (n=4 mice). P-value was calculated using two-tailed Student’s t-test with Welch’s correction.
The western blots in a-c and e-i were performed for n=2 independent experiments with similar results. Unprocessed immunoblots are shown in Source Data Fig. 3. Statistical source data are available in Statistical Source Data Fig. 3.
