
Figure 6 |. Nuclear PD-L1 regulates gene expression of immune response and regulatory pathways.
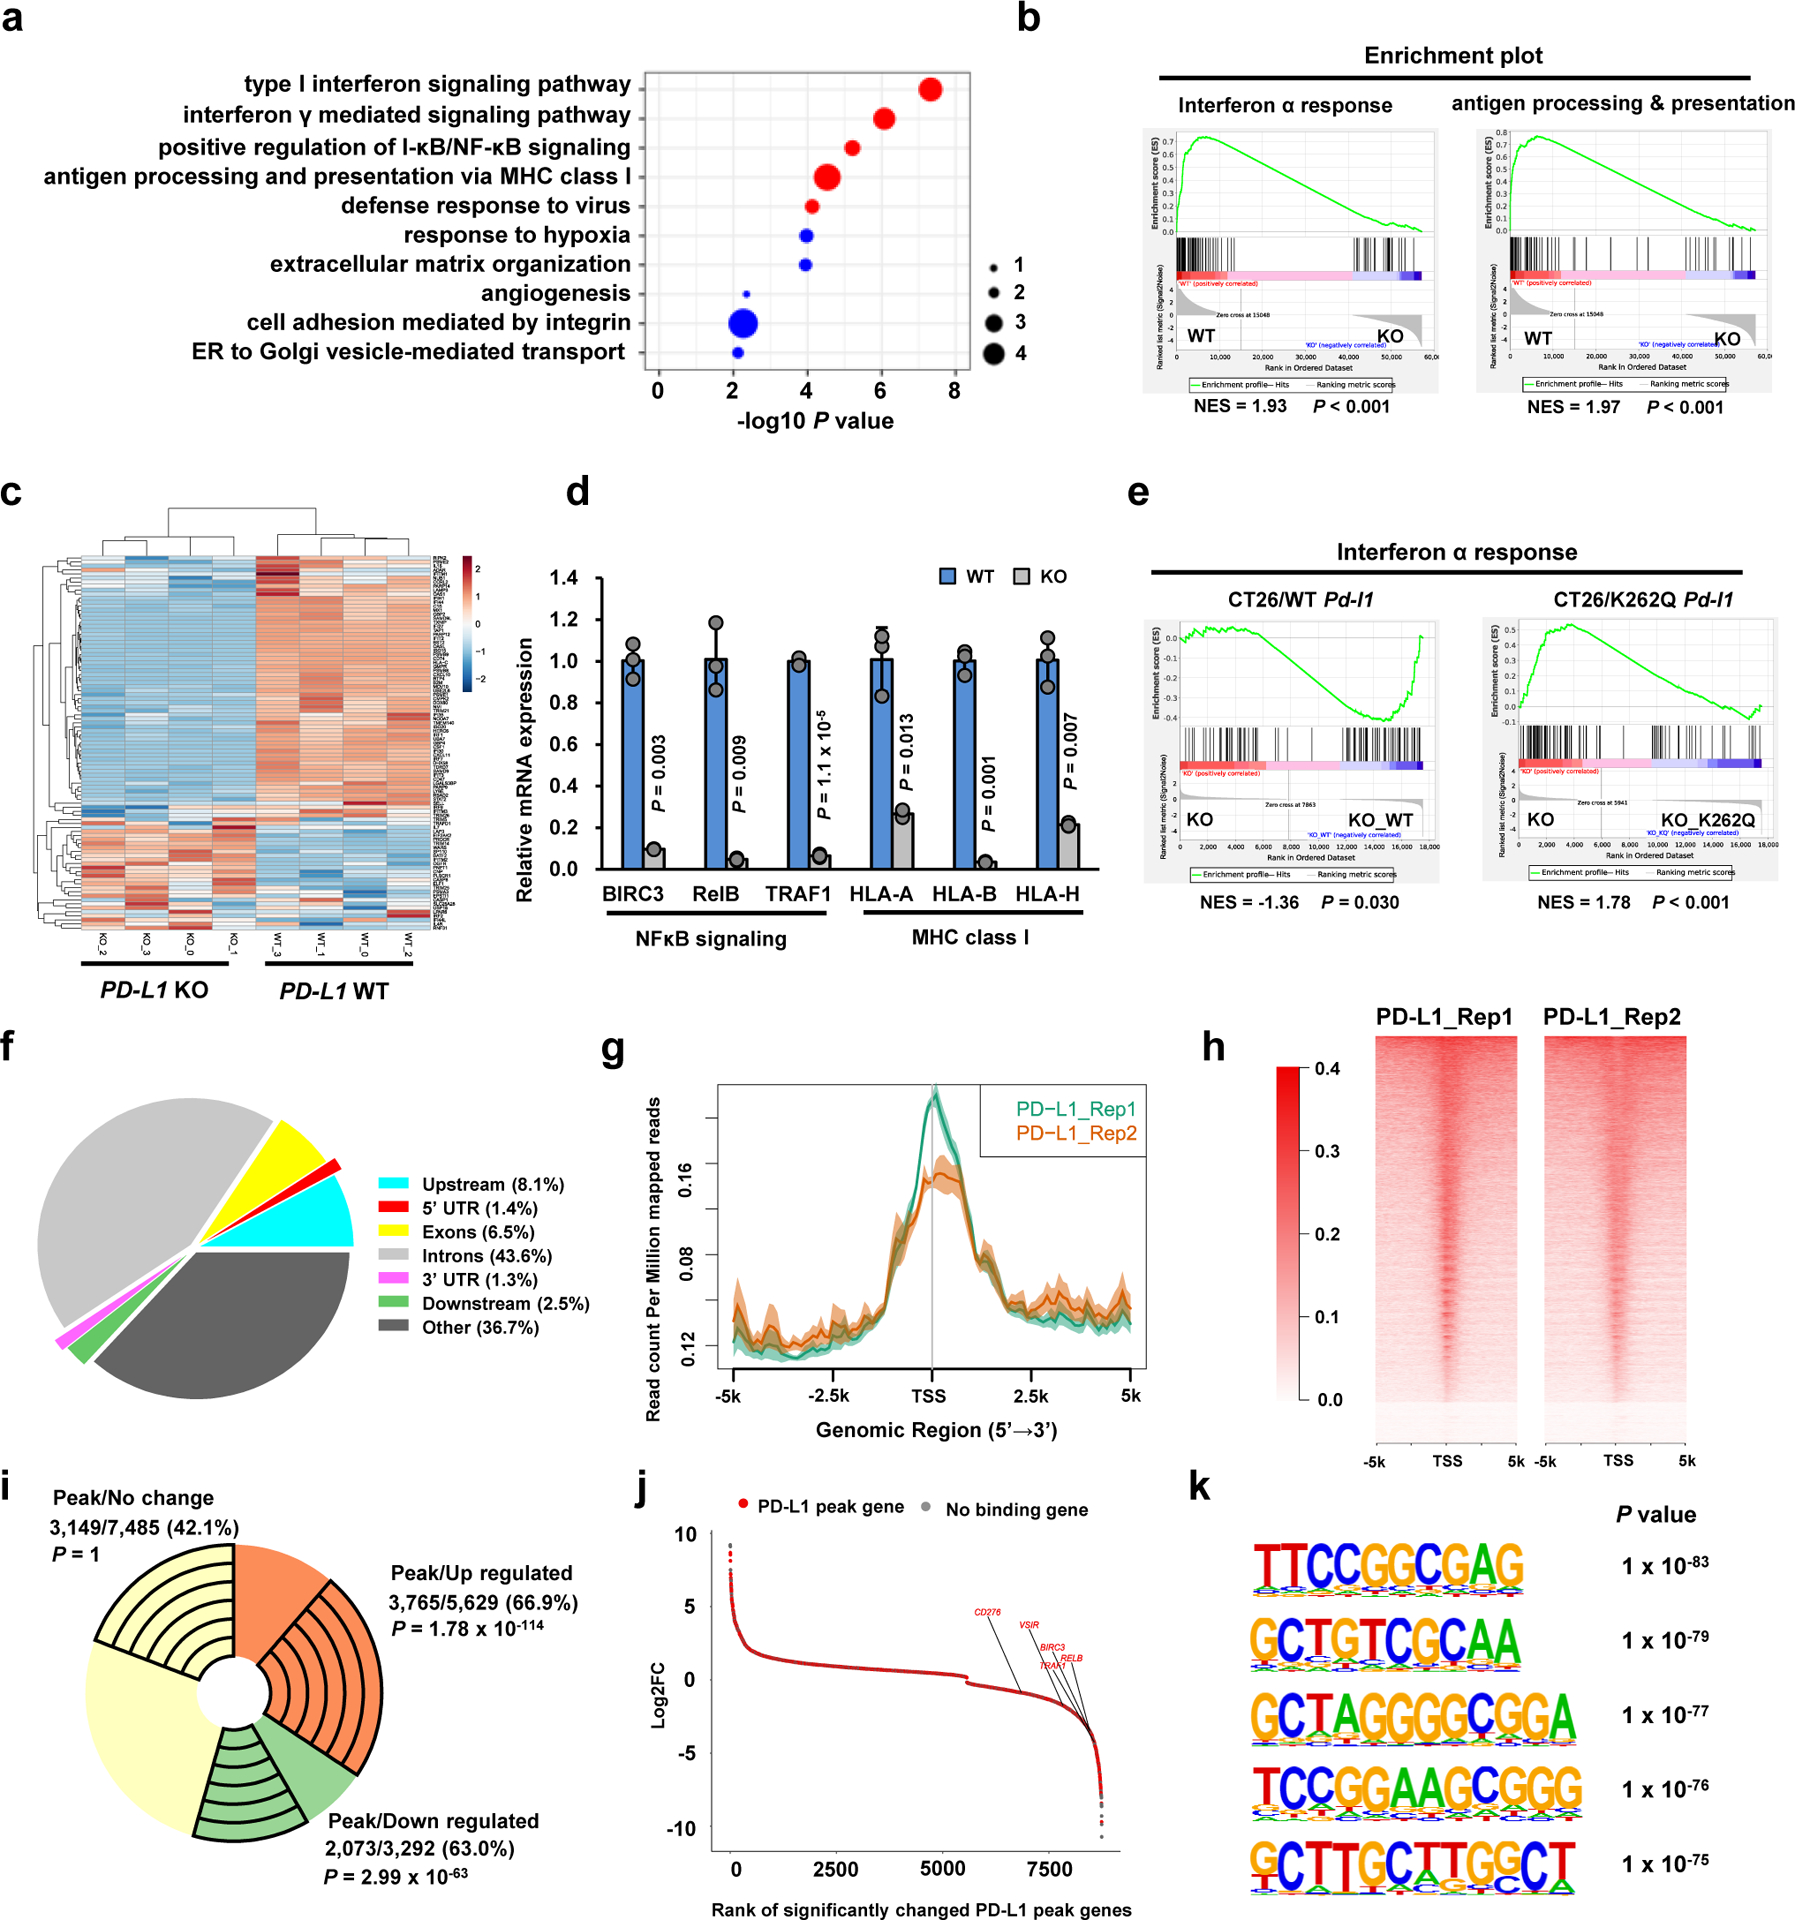
a. Top 10 enriched GO (biological process) terms of down-regulated genes (n=3,292) upon PD-L1 KO in MDA-MB-231 cells (n=4 biologically independent sequenced samples/group) analyzed by modified Fisher’s exact test with Benjamini-Hochberg correction. Immune response-related terms are marked in red. Dot size indicates the ‘Fold enrichment’. b. Down-regulated GSEA signatures upon PD-L1 KO in MDA-MB-231 cells (n=4 biologically independent sequenced samples/group). P-value was calculated using Kolmogorov-Smirnov statistic. c. Heatmap display of the interferon α genes in MDA-MB-231 WT and PD-L1 KO cells. d. qRT-PCR analysis of the indicated genes from MDA-MB-231 WT and PD-L1 KO cells. Data are shown as the mean ± s.d. of n=3 independent experiments. P-values were calculated using a two-tailed Student’s t-test. e. GSEA signatures of ‘Interferon α response’ upon re-expressing mouse WT or K262Q mutant Pd-l1 in Pd-l1 KO CT26 cells (n=3 biologically independent sequenced samples/group), analyzed using Kolmogorov-Smirnov statistic. f. Genomic distribution of HA-tag ChIP-seq peaks in MDA-MB-231 PD-L1 KO cells expressing HA-tagged-PD-L1. g. PD-L1 ChIP-sequencing signal height and position relative to transcription start sites (TSS) for all genes in MDA-MB-231 cells. Two replicates are shown. The line means the average profile of genes; while the shading indicates standard errors (s.e.) of all human hg38 genes (n=58,713). h. ChIP-sequencing density heatmap of PD-L1 enrichment in MDA-MB-231 cells, within 5 kb around TSS. Gene order was arranged from highest to lowest density. i. A pie-chart depicting the fraction of genes with PD-L1 peaks among up-regulated, down-regulated or no change genes upon PD-L1 KO in MDA-MB-231 cells. The exact numbers of genes, percentage and P-values (hypergeometric test) in each group are shown. j. Rank-ordered depiction of the Log2 fold change for each significantly changed gene upon PD-L1 KO. The 5775 genes that have PD-L1 binding peaks are depicted in red. Grey dots indicate genes that have no PD-L1 binding. k. Top enriched motifs in the PD-L1 binding sites (n=50,738) in MDA-MB-231 cells. P-value was calculated using hypergeometric distributions.
Statistical source data are available in Statistical Source Data Fig. 6.