
Figure 1.
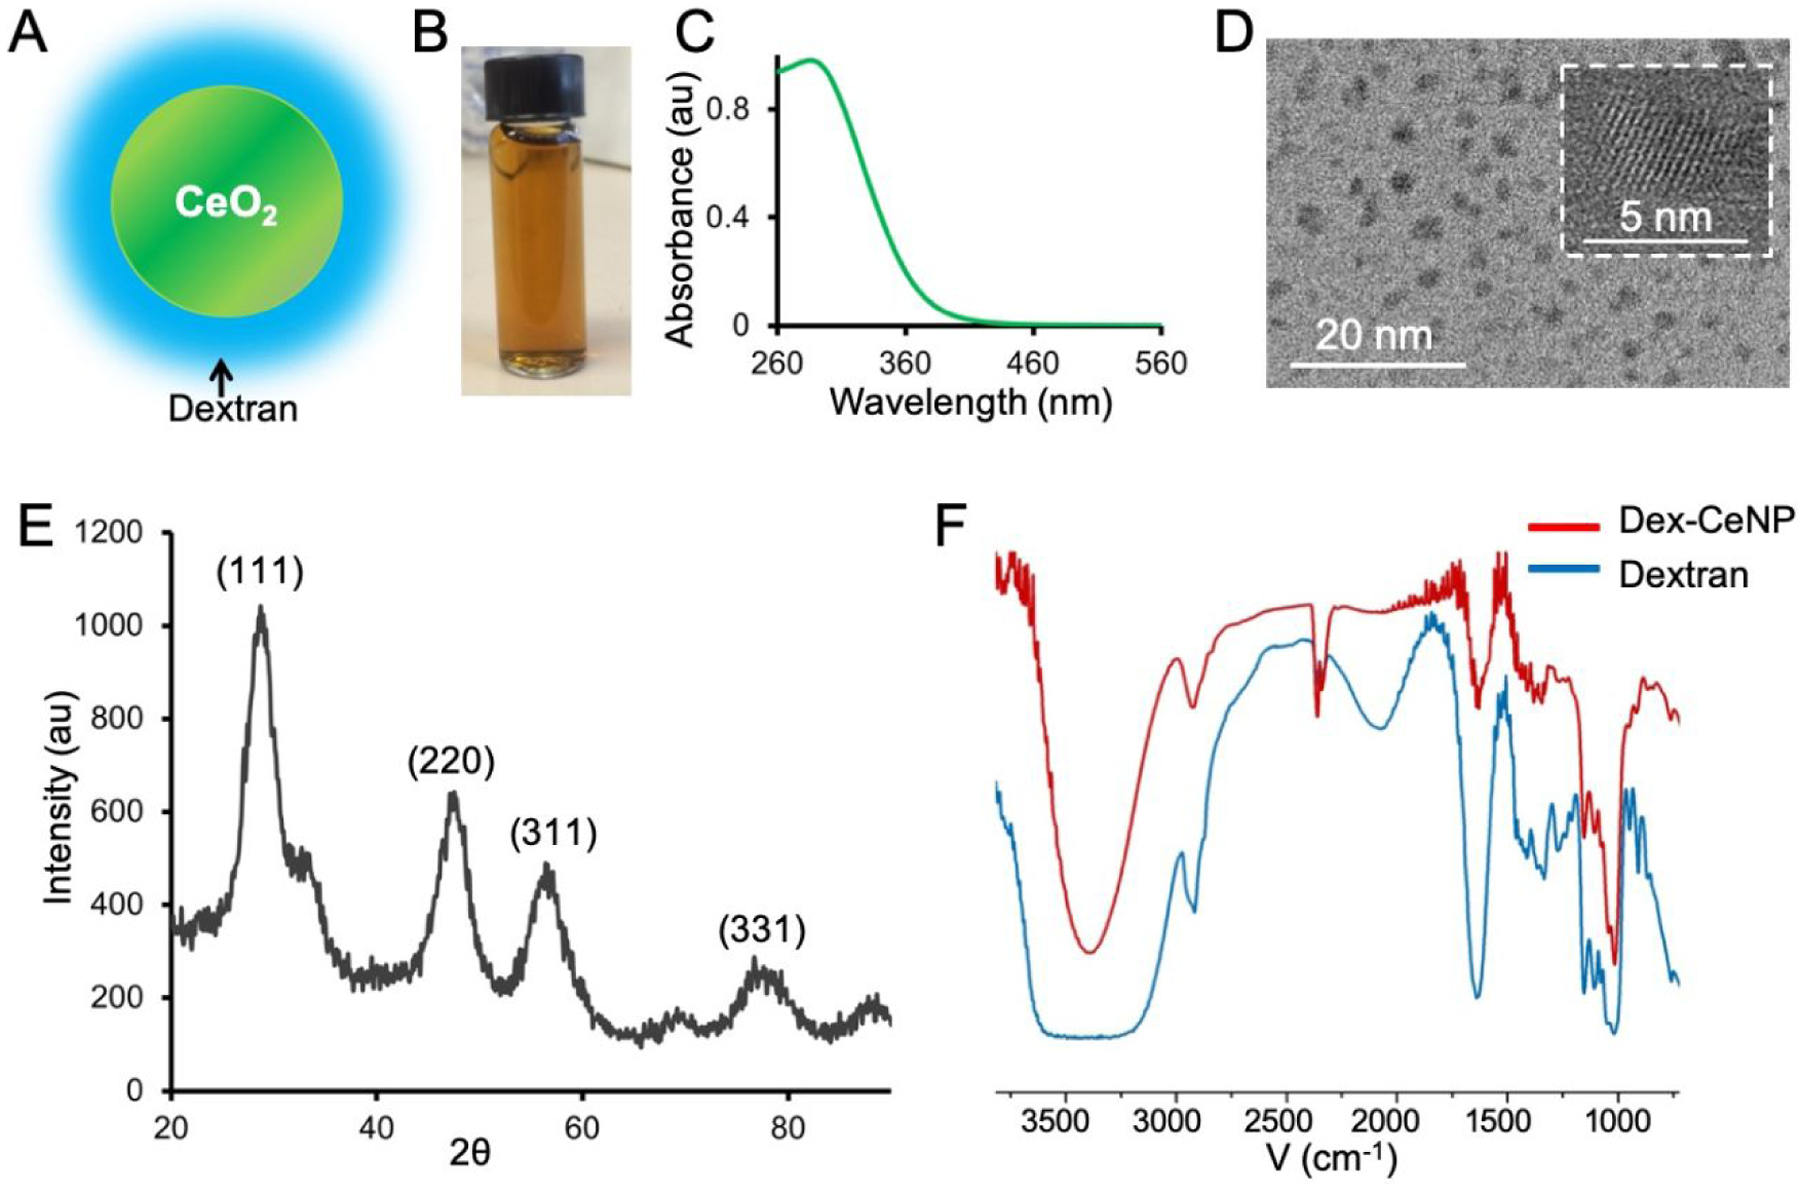
Characterization of Dex-CeNP. A) Schematic depiction of Dex-CeNP. B) Photograph of Dex-CeNP suspended in PBS. C) UV-visble spectrum of Dex-CeNP. D) Transmission electron micrograph (TEM) of Dex-CeNP. HR-TEM of a Dex-CeNP is shown in the white boxed area. E) XRD pattern of Dex-CeNP. F) Fourier transform infra-red (FT-IR) spectra of dextran (blue line) and Dex-CeNP (red line).