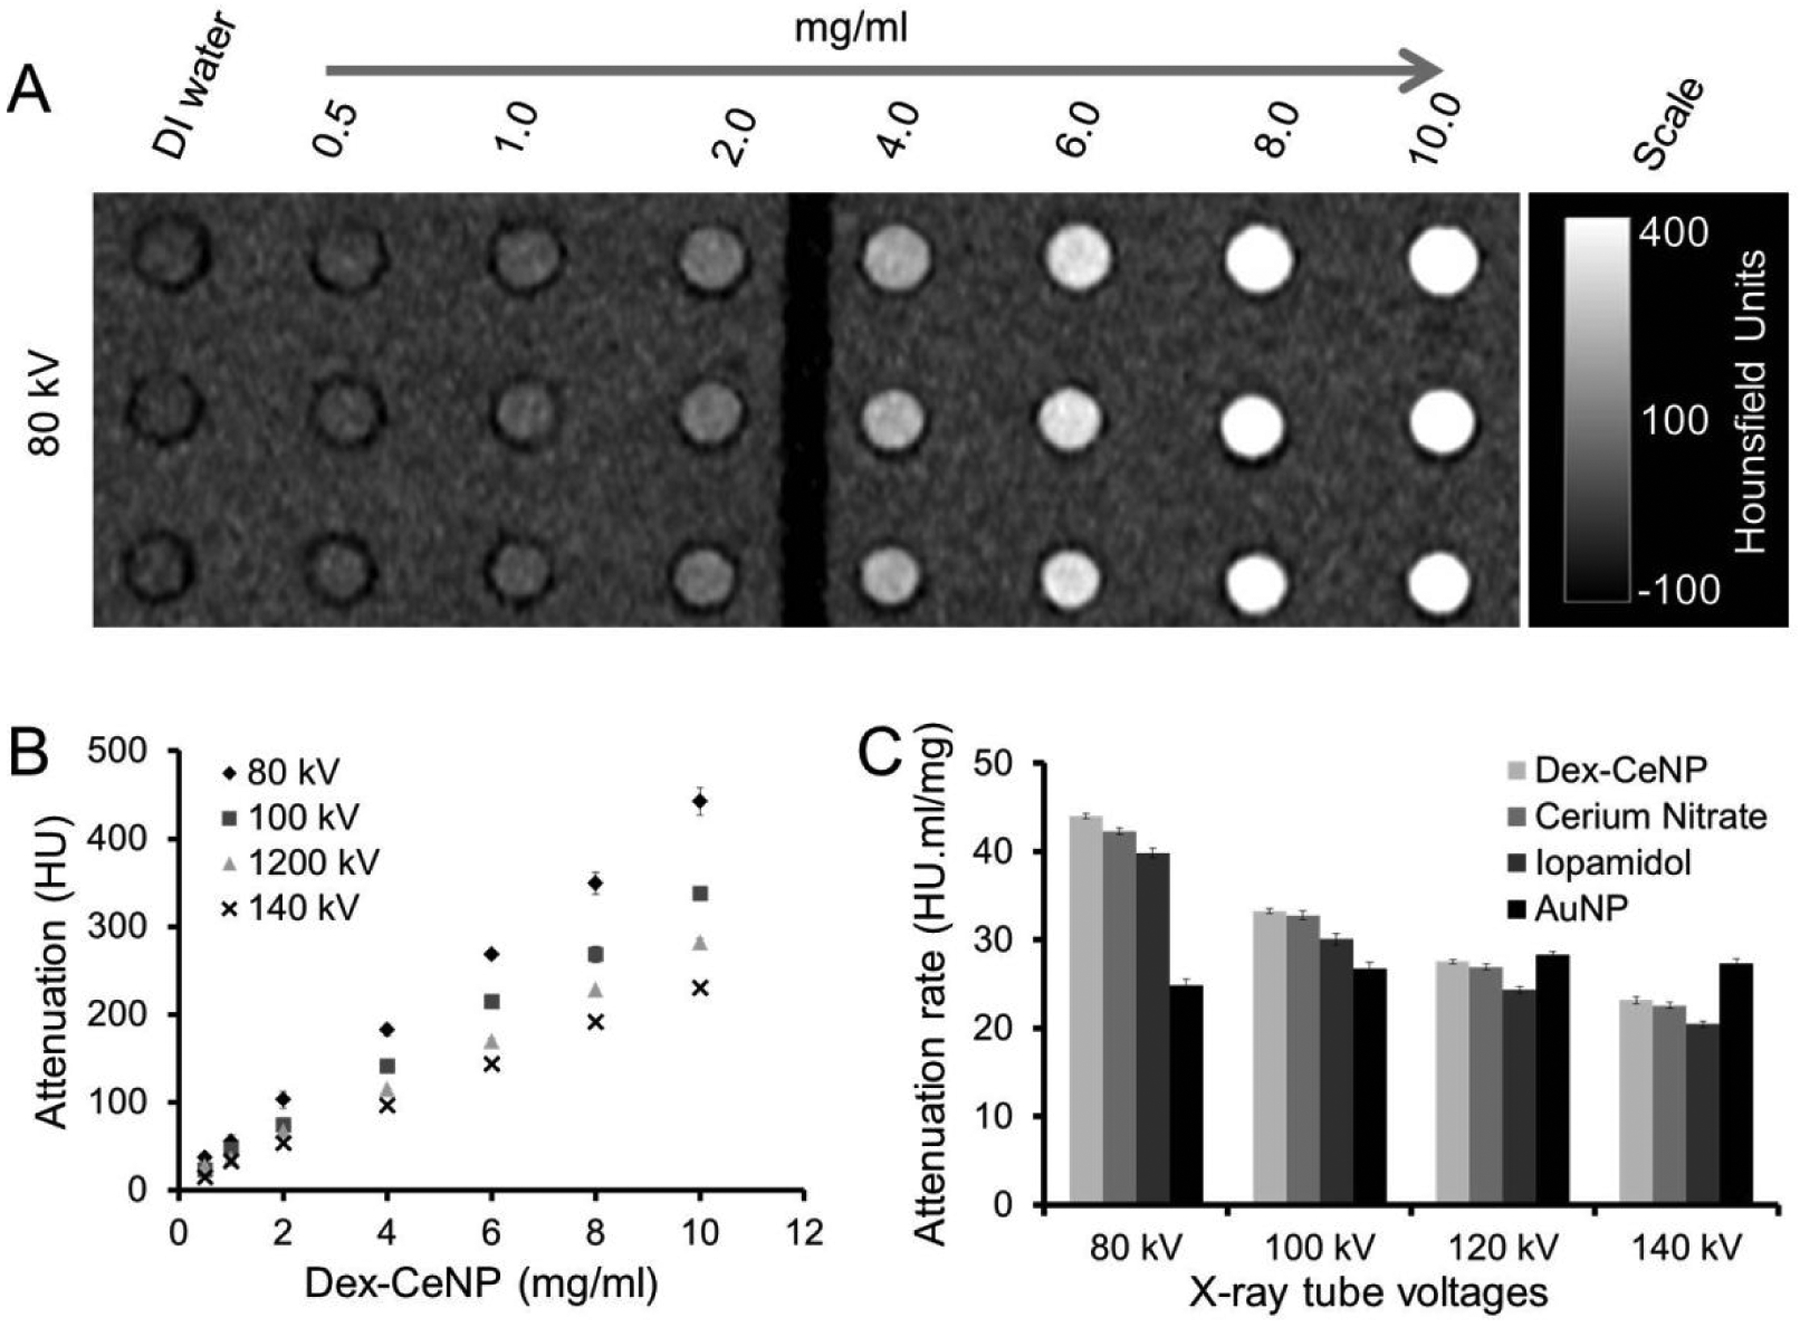
Figure 2.

Contrast generation from a Dex-CeNP phantom scanned with a clinical CT system. A) A representative Dex-CeNP phantom image acquired at 80 kV. B) X-ray attenuation versus mass concentration of cerium when Dex-CeNP were scanned with different tube voltages. Error bars are standard deviations. Some error bars are not visible as they are obscured by the data point. C) X-ray attenuation rates of different contrast agents. Error bars represent standard errors.
