
Figure 5.
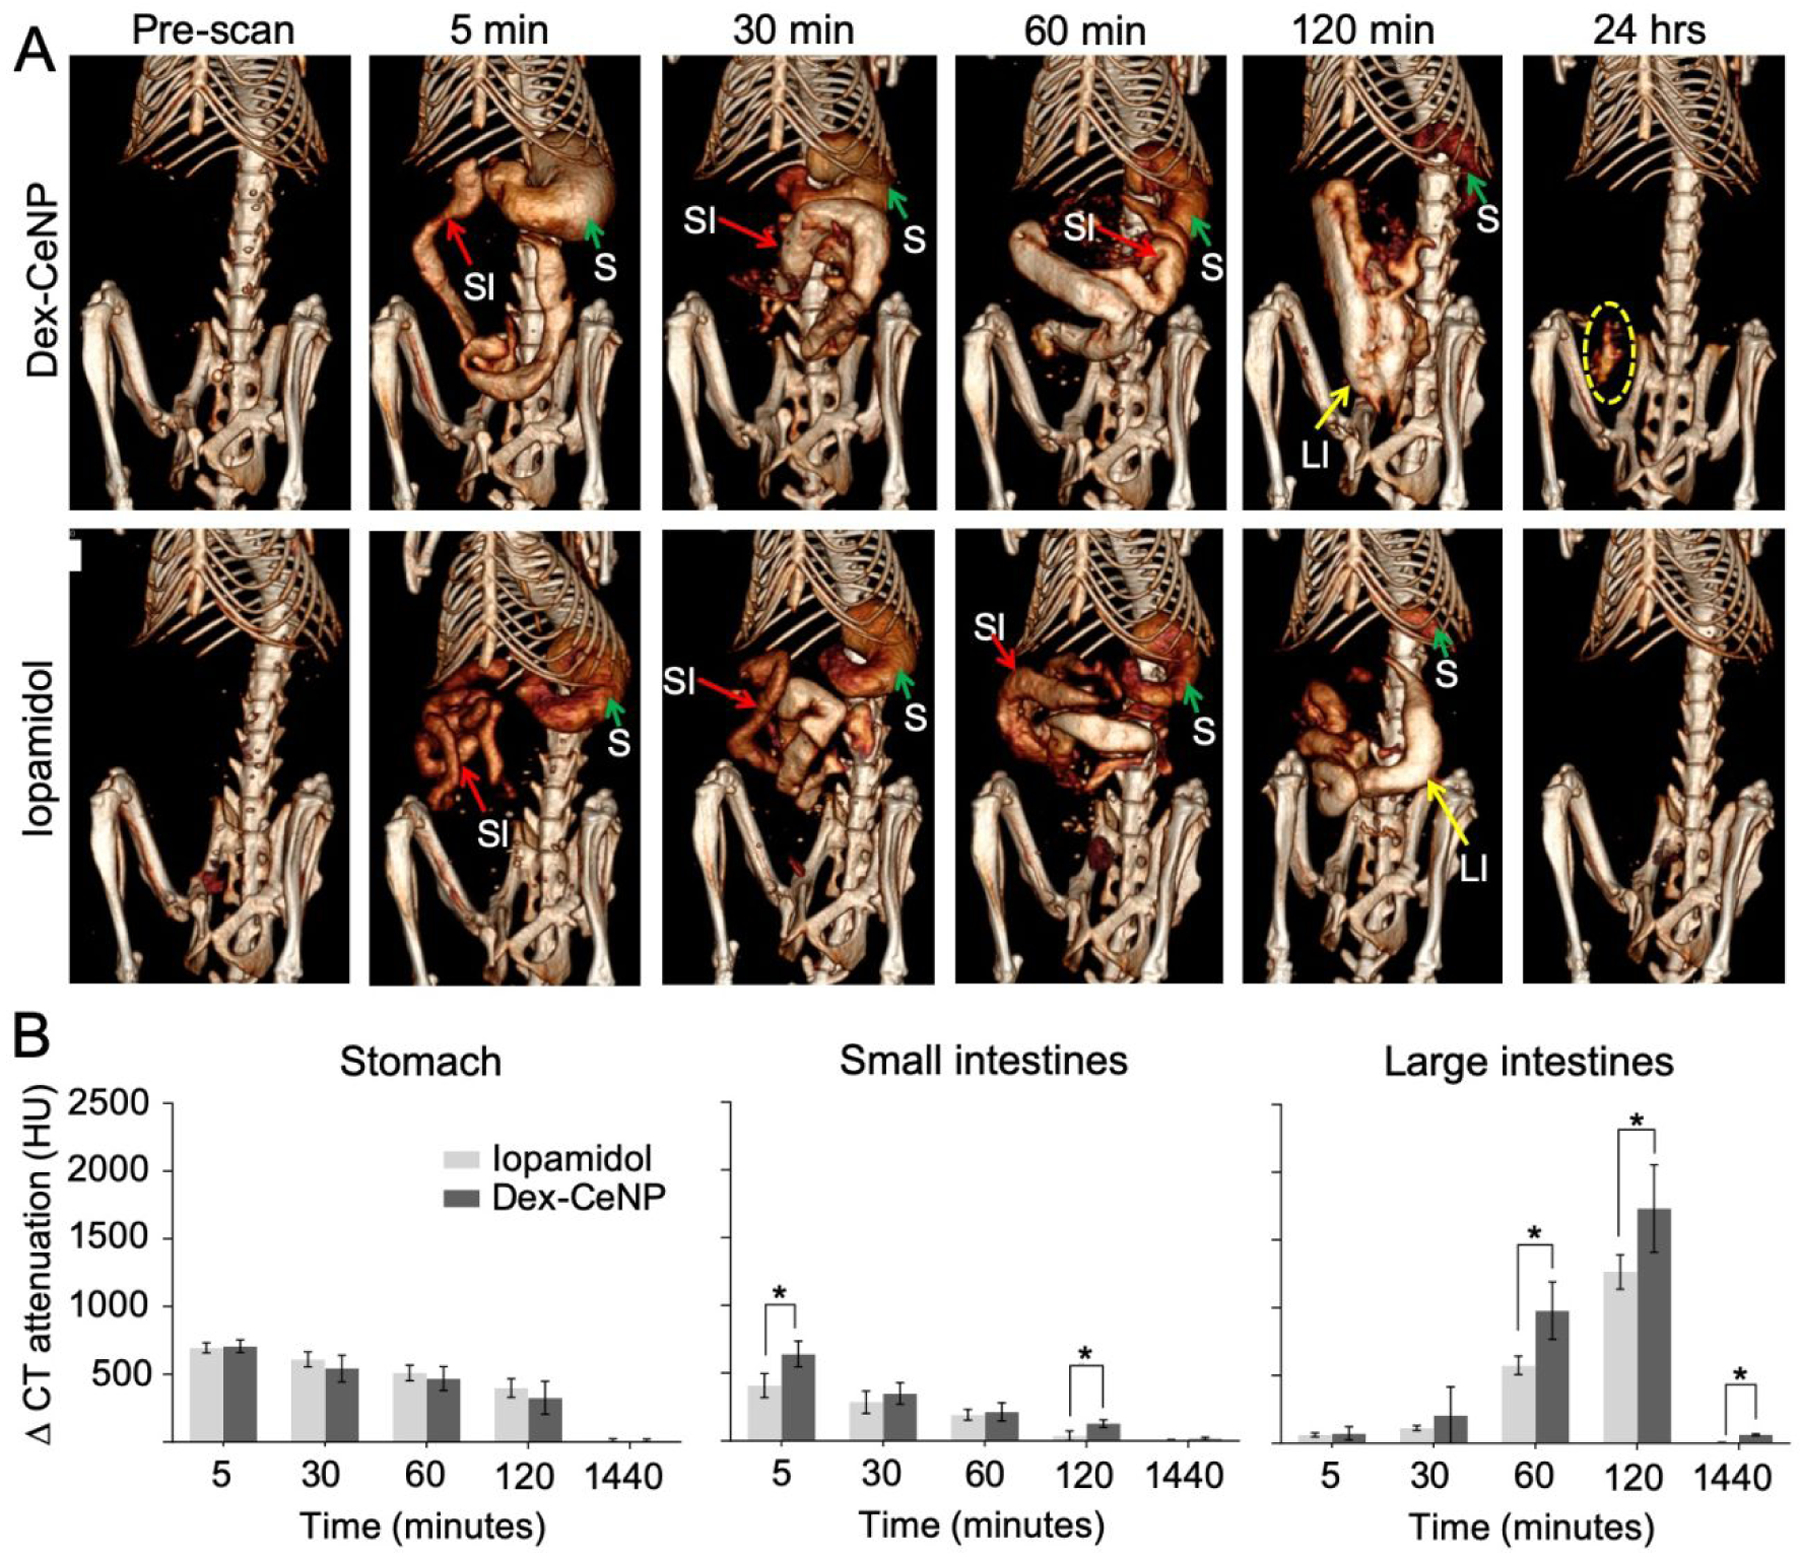
In vivo CT imaging of DSS-induced colitis mice administered Dex-CeNP or iopamidol. A) Representative micro-CT images of colitis mice, pre and post oral administration of Dex-CeNP or iopamidol. ‘S’ indicates the stomach, ‘SI’ indicates the small intestine, and ‘LI’ indicates the large intestine. The yellow dashed oval indicates Dex-CeNP accumulation in an area of colitis. B) CT attenuation in the GIT arising from administration of either Dex-CeNP or iopamidol. Y-axis scale is the same for each graph. For each treatment group six mice (3 male and 3 female) were used. * indicates statistically significant differences at p < 0.05.