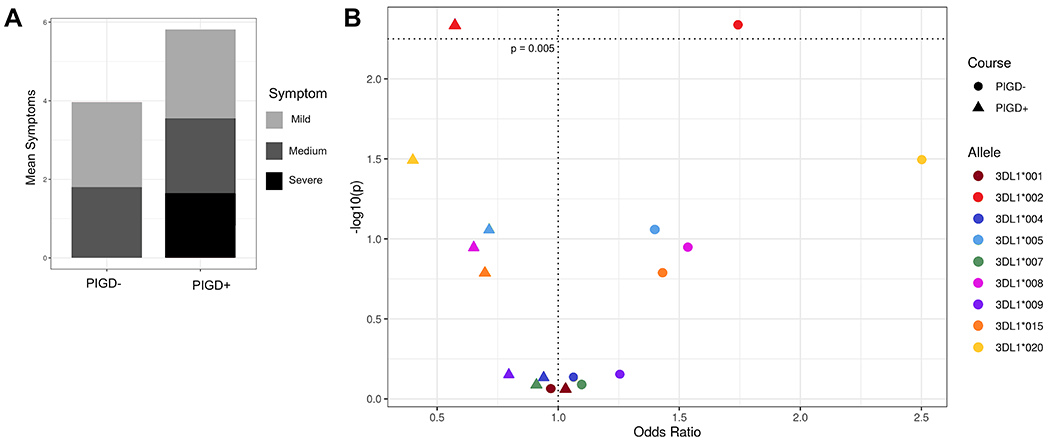
Figure 3. Stratification of PD patients by symptom type.

A) Mean number of symptoms (y – axis) per cluster (x – axis). Symptoms are broken down into three categories where red indicates the most debilitating (postural instability and gait difficulty), coral the moderate symptoms (rigidity and bradykinesis), and light pink the mild symptoms associated with less severe disease (resting and activation tremors and asymmetric onset). B) KIR3DL1 allele-HLA-Bw4 associations with disease group. Odds ratio (x – axis) by -log10(p-value) (y – axis). Each dot represents a KIR3DL1 allele-HLA ligand pair, the different shapes indicate PIGD- (circle) or PIGD+ (triangle) disease. The horizontal dotted line indicates the value for a significant corrected p-value.
