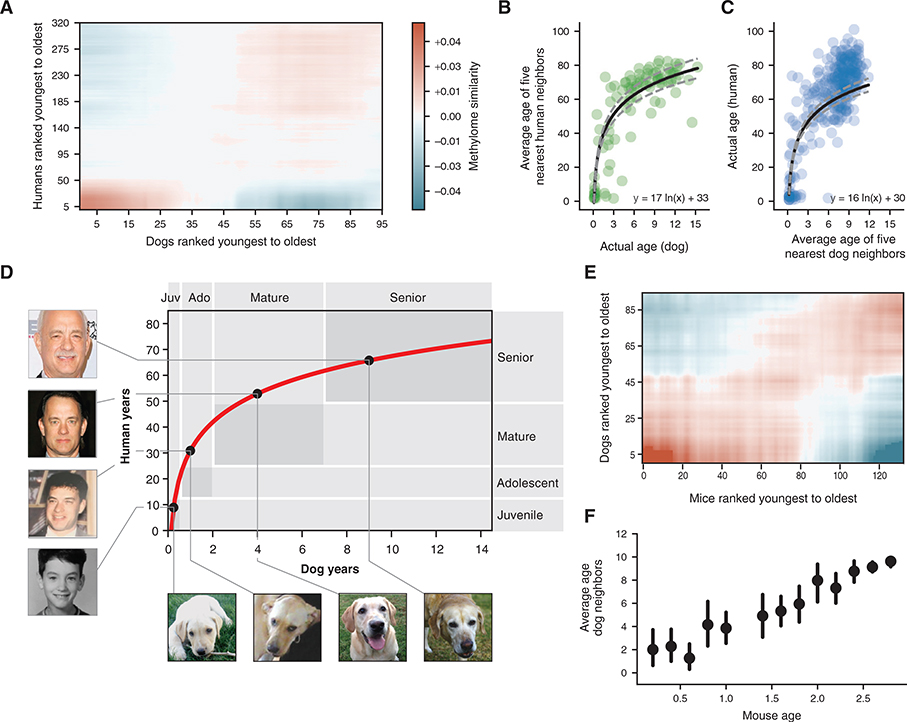
Figure 3. A Nonlinear Transformation from Dog-to-Human Age.
(A) Dog-human methylome similarities (Pearson correlation, blue-red color range) are shown with dogs and humans ranked from youngest to oldest. Data are lightly smoothed in both dimensions using Gaussian interpolation in matplotlib.
(B) The age of each dog methylome (x axis) is plotted against the average age of the five nearest human methylomes (y axis), 95 dogs are depicted.
(C) Reciprocal plot in which the age of each human methylome (y axis) is plotted against the average age of the five nearest dog methylomes (x axis), 320 humans are depicted.
(D) Logarithmic function for epigenetic translation from dog age (x axis) to human age (y axis). Outlined boxes indicate the approximate age ranges of major life stages as documented qualitatively based on common aging physiology. Juvenile refers to the period after infancy and before puberty, 2–6 months in dogs, 1–12 years in humans; adolescent refers to the period from puberty to completion of growth, 6 months to 2 years in dogs, approximately 12–25 years in humans; Mature refers to the period from 2–7 years in dogs and 25–50 years in humans; Senior refers to the subsequent period until life expectancy, 12 years in dogs, 70 years in humans. Dog life stages are based on veterinary guides and mortality data for dogs (Fleming et al., 2011; Bartges et al., 2012; Inoue et al., 2015). Human life stages are based on literature summarizing life cycle and lifetime expectancy (Bogin and Smith, 1996; CIA, 2013; Arias et al., 2017). Black dots on the curve connect to images of the same yellow Labrador taken at four different ages (courtesy of Sabrina and Michael Mojica, with permission) and to images of a representative human at the equivalent life stages in human years (photos of Tom Hanks drawn from a public machine-learning image repository, Chen et al., 2015).
(E) Mouse-dog methylome similarities shown as in (A).
(F) Data from (E) are summarized by sorting mice according to 0.2-year bins (x axis) and, for each mouse, plotting the average age of the 5 nearest dogs by methylome similarity (y axis). Points illustrate the mean of each bin and bars represent the 95% confidence interval obtained from bootstrapping.

