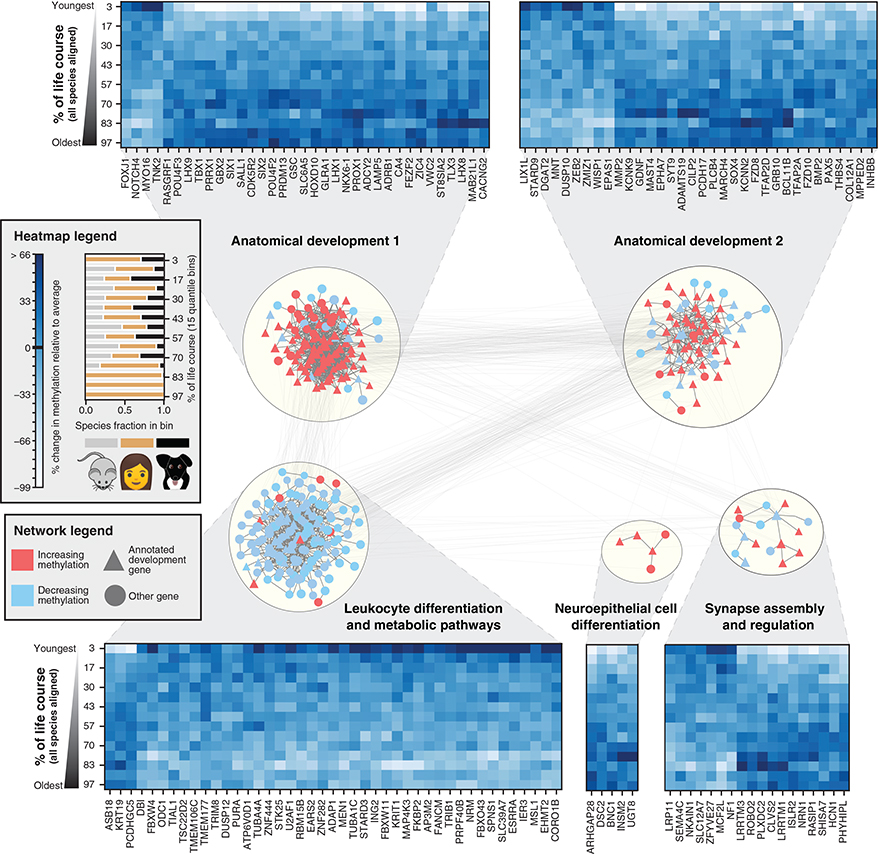
Figure 4. Conserved Lifetime Methylation Changes Aggregate in Developmental Networks.
Genes exhibiting conserved age-related methylation behavior were mapped onto a composite molecular interaction network which was subsequently clustered to reveal five major modules, labeled according to enriched Gene Ontology functions (STAR Methods). Colors represent the conserved direction of change with age, with red representing genes that increase in methylation with age and blue representing genes that decrease in methylation with age. Heatmaps show the conserved methylation patterns of a random subset of genes in each module. Columns represent distinct orthologs, while rows represent the average values of all species ranked according to their age in human years and divided into 15 age bins (quantiles). Values are normalized according to the mean and standard deviation of methylation for each ortholog. The fractional species composition of each bin is visualized in the legend.

