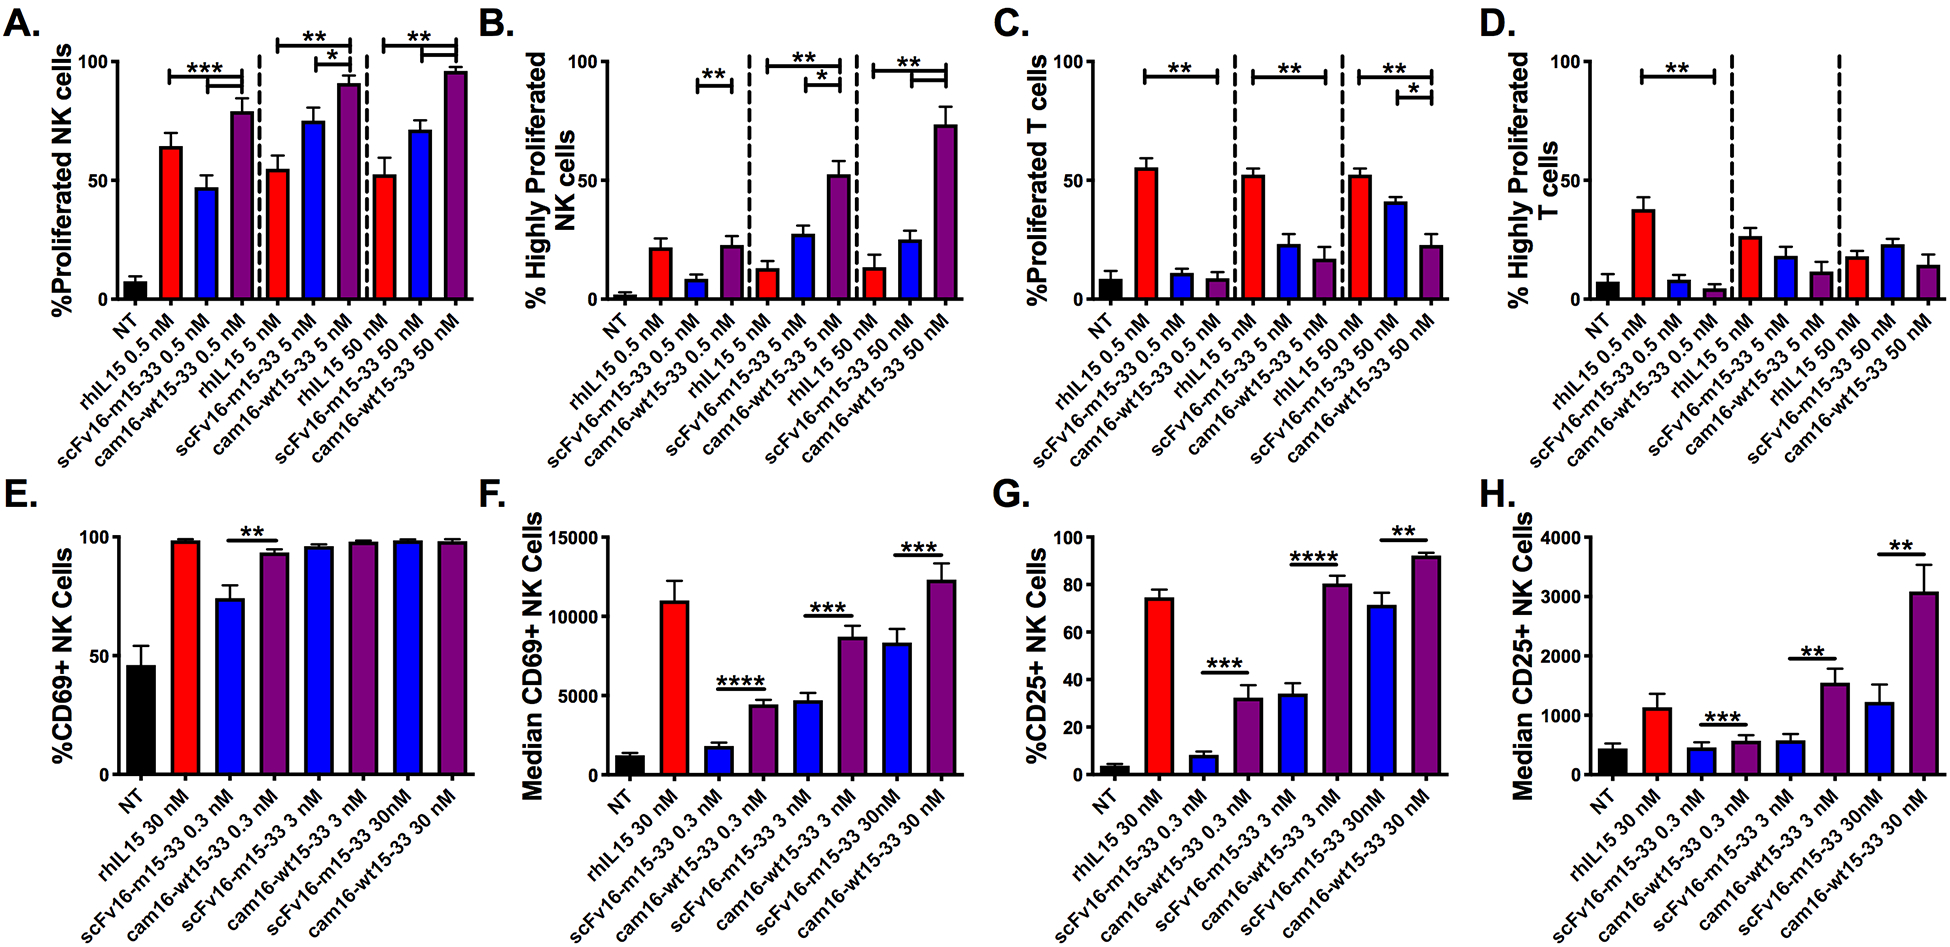
Figure 2. Second-generation cam16-wt15–33 TriKE demonstrates potent IL15 signaling with enhanced NK cell specificity.

(A-D) PBMCs were CellTrace labeled and incubated for 7 days with noted concentrations of rhIL15 (red), scFv16-m15–33 TriKE (blue), and cam16-wt15–33 TriKE (purple). At the end of the 7 days, cells were harvested, stained, and evaluated by flow cytometry. (a) The proportion of NK cells that proliferated or (b) that highly proliferated (greater than three divisions) with the indicated treatments (N=5). (c) The proportion of T cells that proliferated or (d) that highly proliferated with the indicated treatments (N=5). (A-D) One-way ANOVA with repeated measures was used to calculate differences against the cam16-wt15–33 group within each of the concentrations. Bars show mean±SEM and statistical significance as *P<0.05, **P<0.01, and ***P<0.001. (E-H) NK cells were activated overnight (16 hours) with the noted stimuli or nothing (NT) and activation marker expression was assessed. (e) The CD69+ proportion and (f) median fluorescence intensity (MFI), as well as (g) CD25+ proportion and (h) MFI, was assessed at the time of harvest on NK cells (N=7). Paired T tests between the scFv16-m15–33 and cam16-wt15–33 TriKEs were carried out within each of the concentrations. Bars show mean±SEM and statistical significance as *P<0.05, **P<0.01, ***P<0.001, and ****P<0.0001.
