
Figure 3. Second-generation cam16-wt15–33 TriKE induces stronger NK cell activation against CD33+ targets.
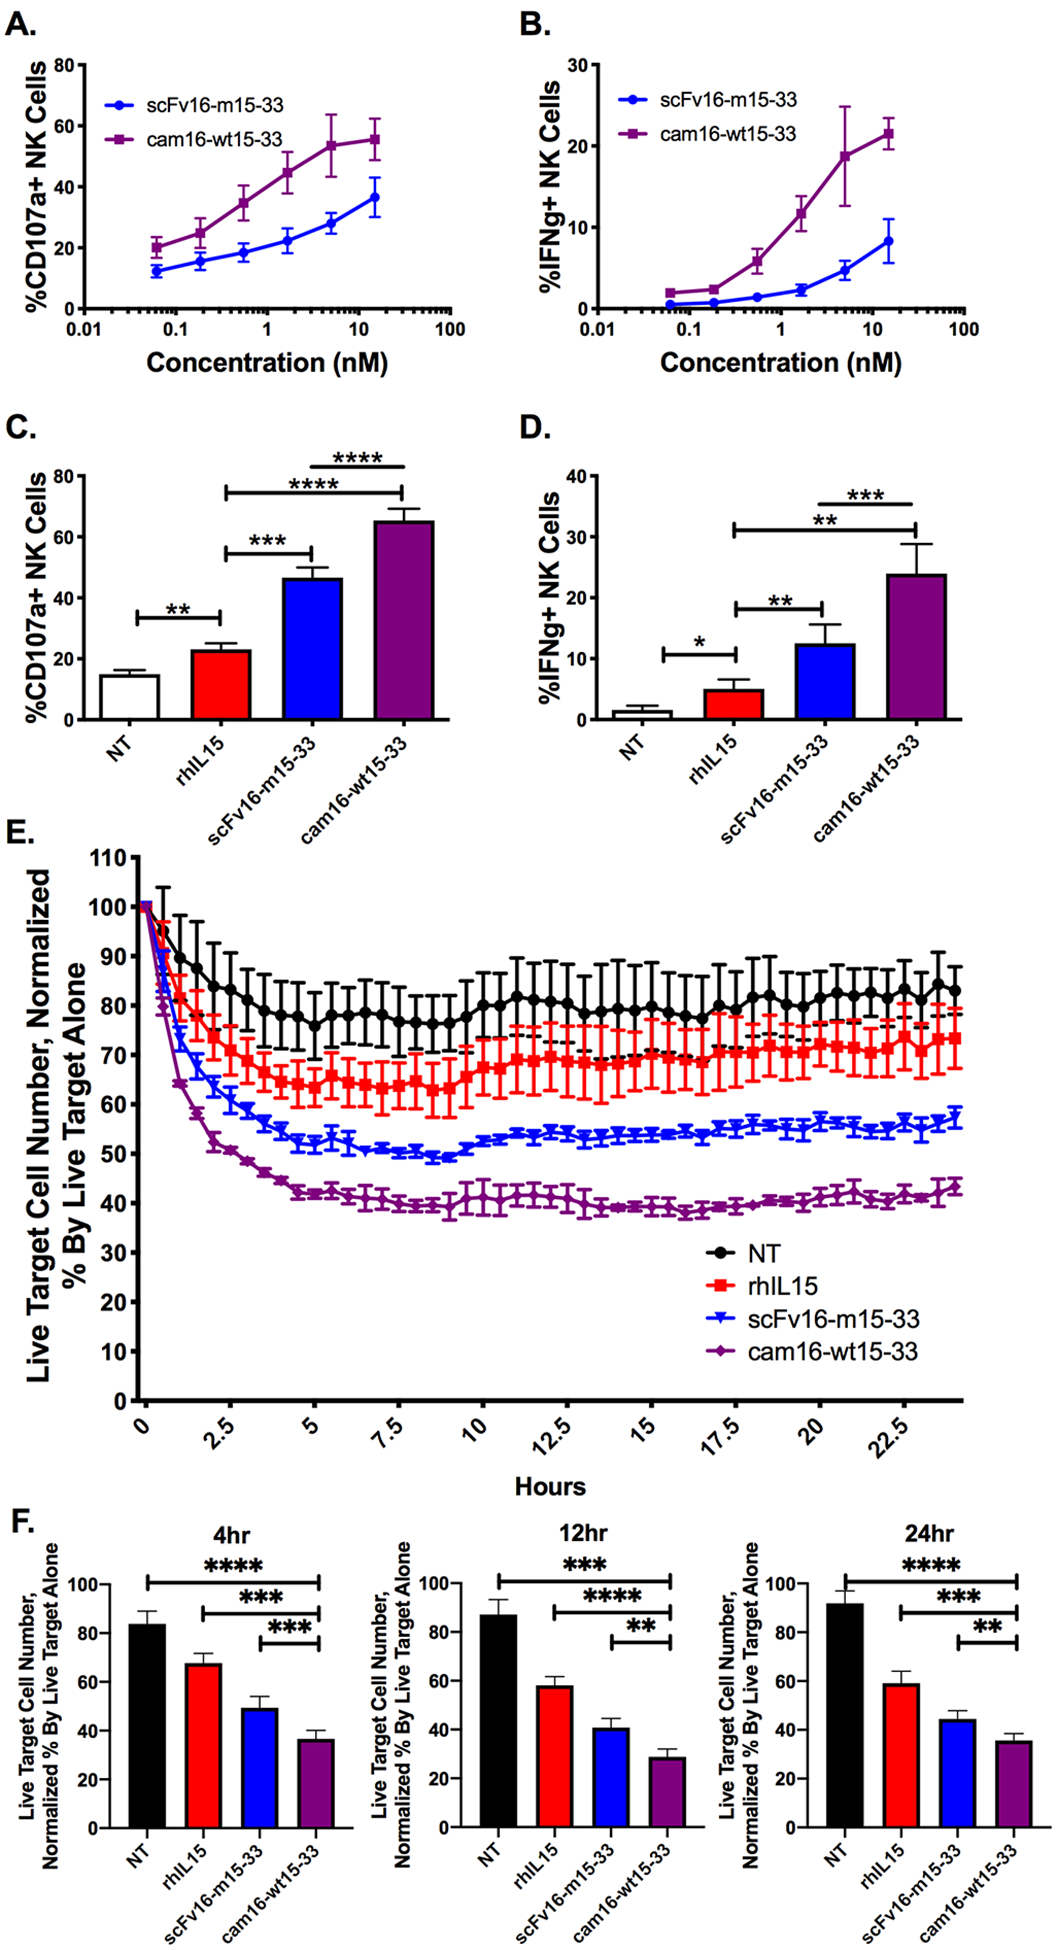
(a) NK cell degranulation (% CD107a+) and (b) IFNγ production were evaluated within PBMCs incubated with CD33+ HL-60 tumor targets at a 2:1 ratio for 4 hours with the indicated concentrations of TriKEs (N=4). (c) Proportion of NK cells expressing CD107a and (d) IFNγ after a 4-hour incubation with 30 nM TriKEs and HL-60 targets (N=8). NT: control (no treatment). (A-D) One-way ANOVA with repeated measures was used to calculate differences against the rhIL15 control group (brackets), and TriKEs were compared with paired T test (lines). (e) A representative experiment of an IncuCyte imaging assay was used to evaluate NK cell–mediated killing of CellTrace Far Red labeled targets over a 24-hour period with the indicated treatments (30 nM). The number of live tumor cells (CellTrace Far Red+Caspase3/7–) was normalized to the number of live tumor targets without effectors to create a percent of remaining cells. (f) Pooled IncuCyte live cell analysis at 4, 12, and 24 hours (N=9). One-way ANOVA with repeated measures was used to calculate differences against cam16-wt15–33. Bars show mean±SEM and statistical significance as *P<0.05, **P<0.01, ***P<0.001, and ****P<0.0001.