
Figure 3. Performance of the sDz/PDz cascade interrogating the katG gene.
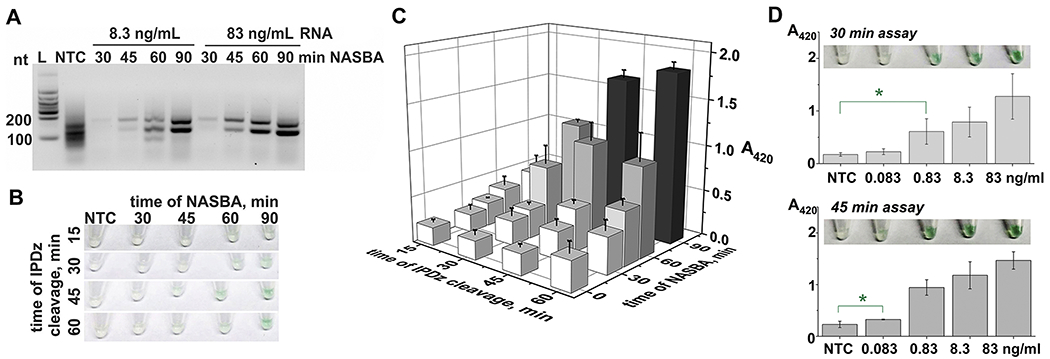
A. Analysis of the NASBA products obtained from 8.3 ng/mL or 83 ng/mL total MTC RNA by 2% agarose gel electrophoresis. The NASBA reaction was carried out for 30, 45, 60, or 90 min. NTC – NASBA “no-target control”, incubated for 90 min; L – low-range RNA ladder. B and C. The NASBA samples from panel A obtained using 8.3 ng/mL RNA were added (3.3% v/v) to the cascade containing strands kG_INHS and kG_U and. The samples’ color change (B) and absorbance at 420 nm (C) was recorded upon 15-, 30-, 45-, or 60-min IPDz cleavage at 50 °C. The sample indicated as “0 min NASBA” is NTC. D. Absorbance at 420 nm and tube images of the samples containing kG_NASBA_INHS amplicon obtained with different pre-amplified RNA concentrations. NASBA was performed for 60 min, and the samples were incubated at 50 °C for 30 min (top) or 45 min (bottom). The data is given as average of three independent experiments, with relative standard deviations indicated.