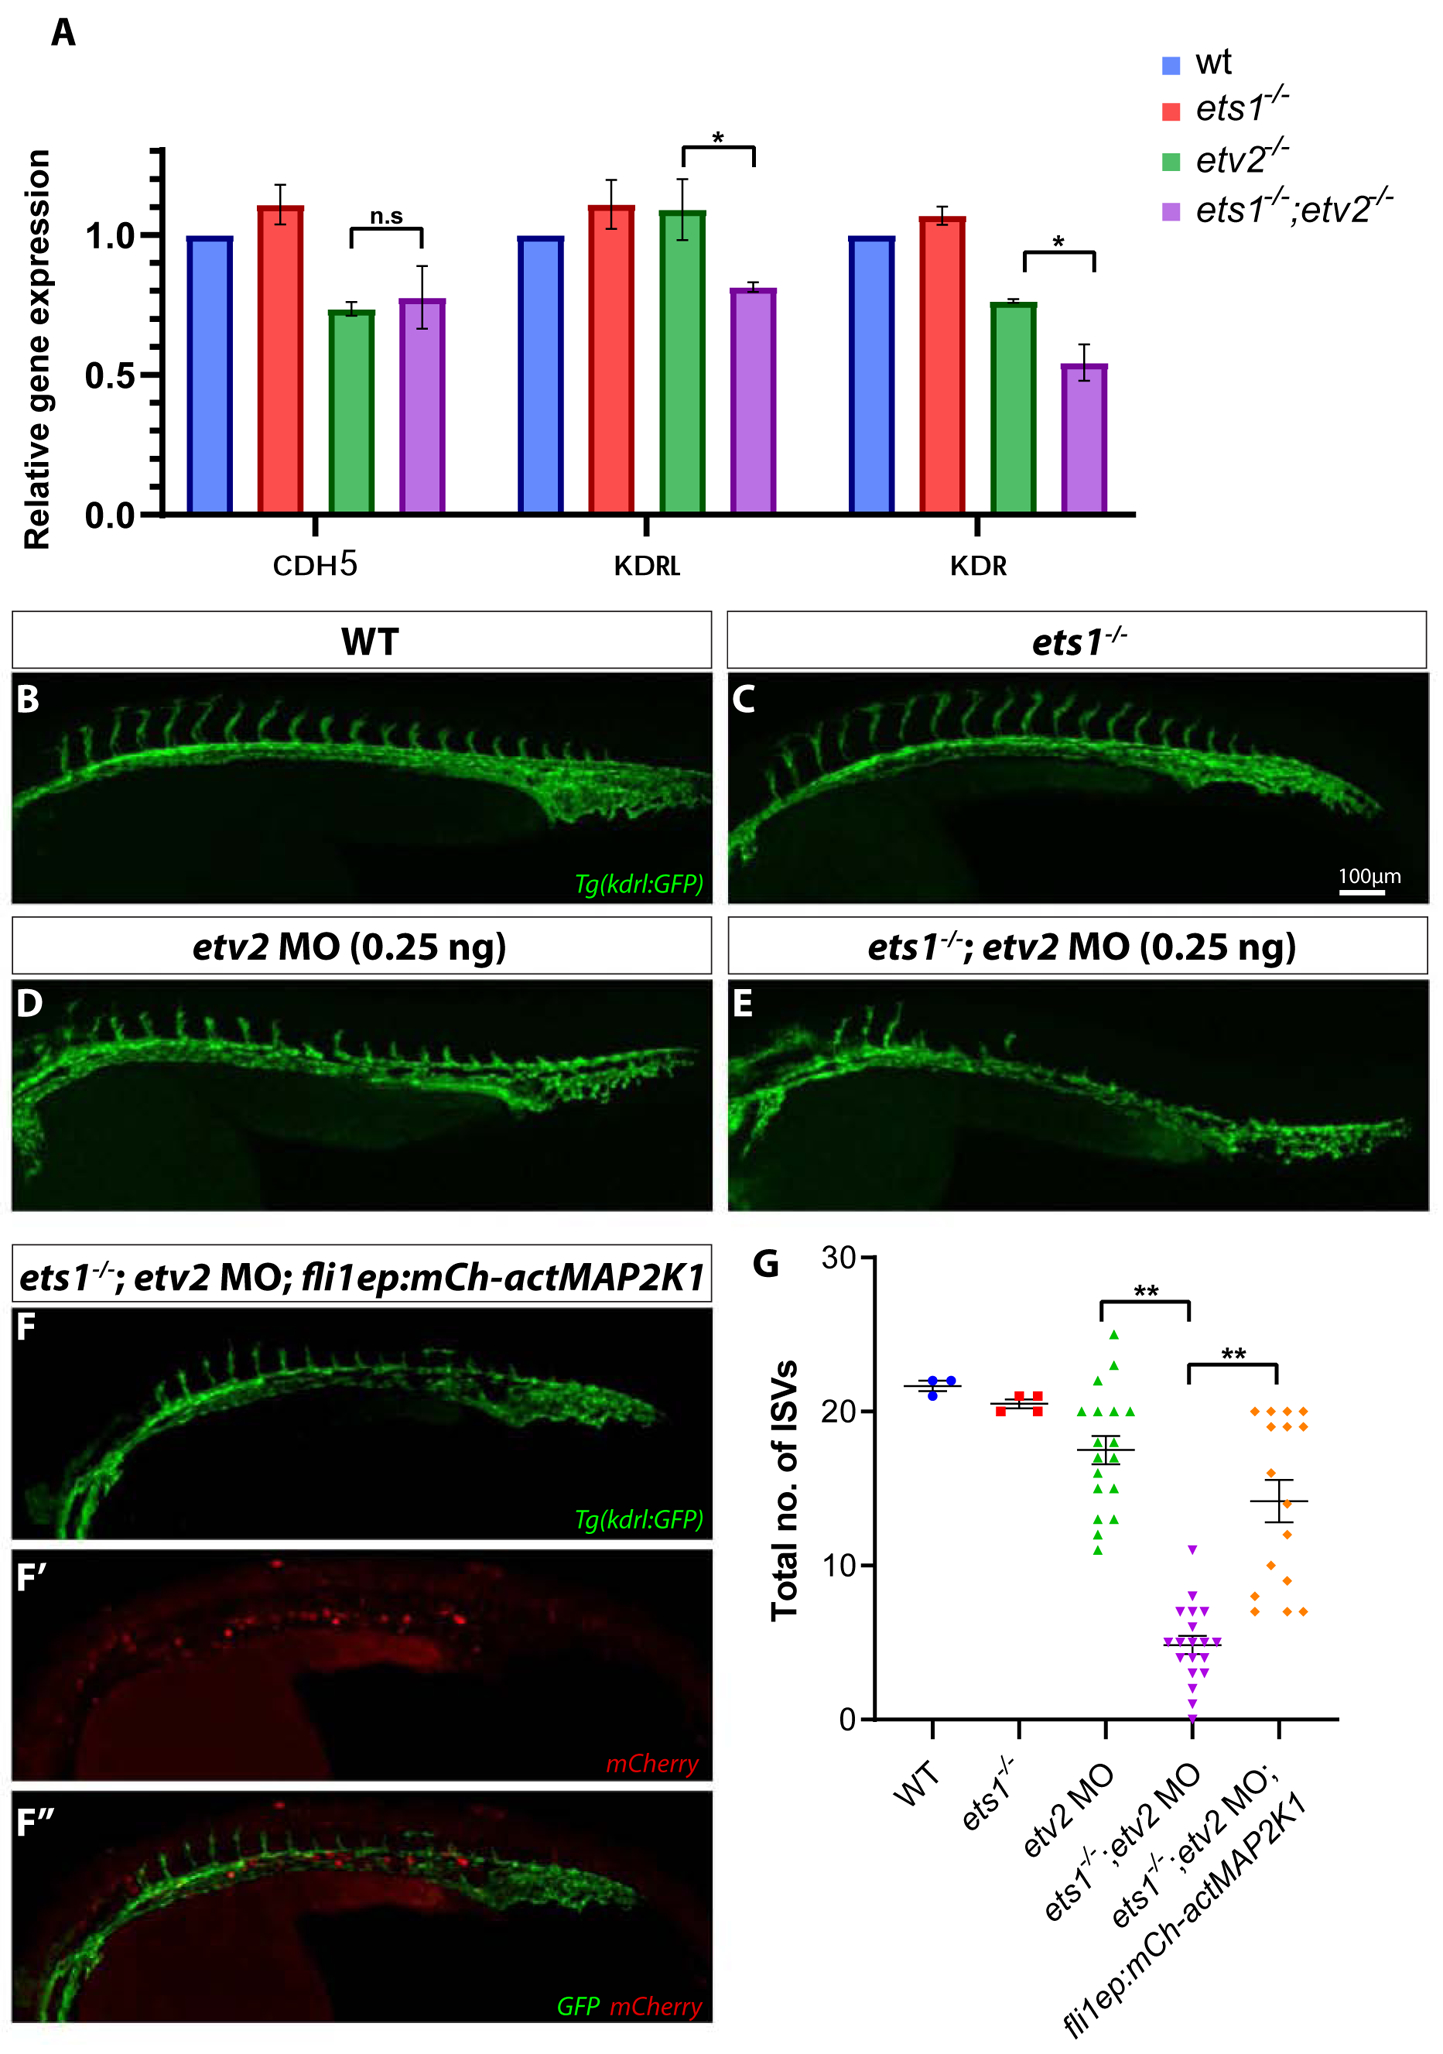
Figure 2. Overexpression of a constitutively active MAP2K1 construct compensates for a reduction in kdrl and kdr expression and partially rescues angiogenic defects in ets1−/−; etv2 MO embryos.

(A) qPCR analysis of endothelial genes cdh5, kdrl and kdr in whole embryos at 32 hpf. Note the reduction in kdrl and kdr expression in ets1−/−; etv2−/−embryos compared to etv2−/−embryos (B-F’’) Confocal images of 28 hpf Tg(kdrl:GFP) wildtype, ets1−/−, etv2 MO (0.25 ng), ets1−/−; etv2 MO (0.25 ng) and ets1−/−; etv2 MO; fli1aep:mCh-actMAP2K1 embryos. Note the mild angiogenic defects in etv2 MO (0.25 ng) embryos (D) and more severe defects in ets1−/−; etv2 MO embryos(E). (F-F’’) Split images showing vascular GFP expression (F), mCherry expression from the actMAP2K1 construct (F’) and a merged image with GFP and mCherry (F’’). (G) Quantification of ISVs in embryos from B-F. Note the increase in the number of ISVs in ets1−/−; etv2 MO; fli1aep:mCh-actMAP2K1 embryos compared to the ets1−/−; etv2 MO embryos. *P<0.05, ** P<0.01; n.s – not significant; columns and horizontal bars in dotplots represent mean, error bars represent ± SEM.
