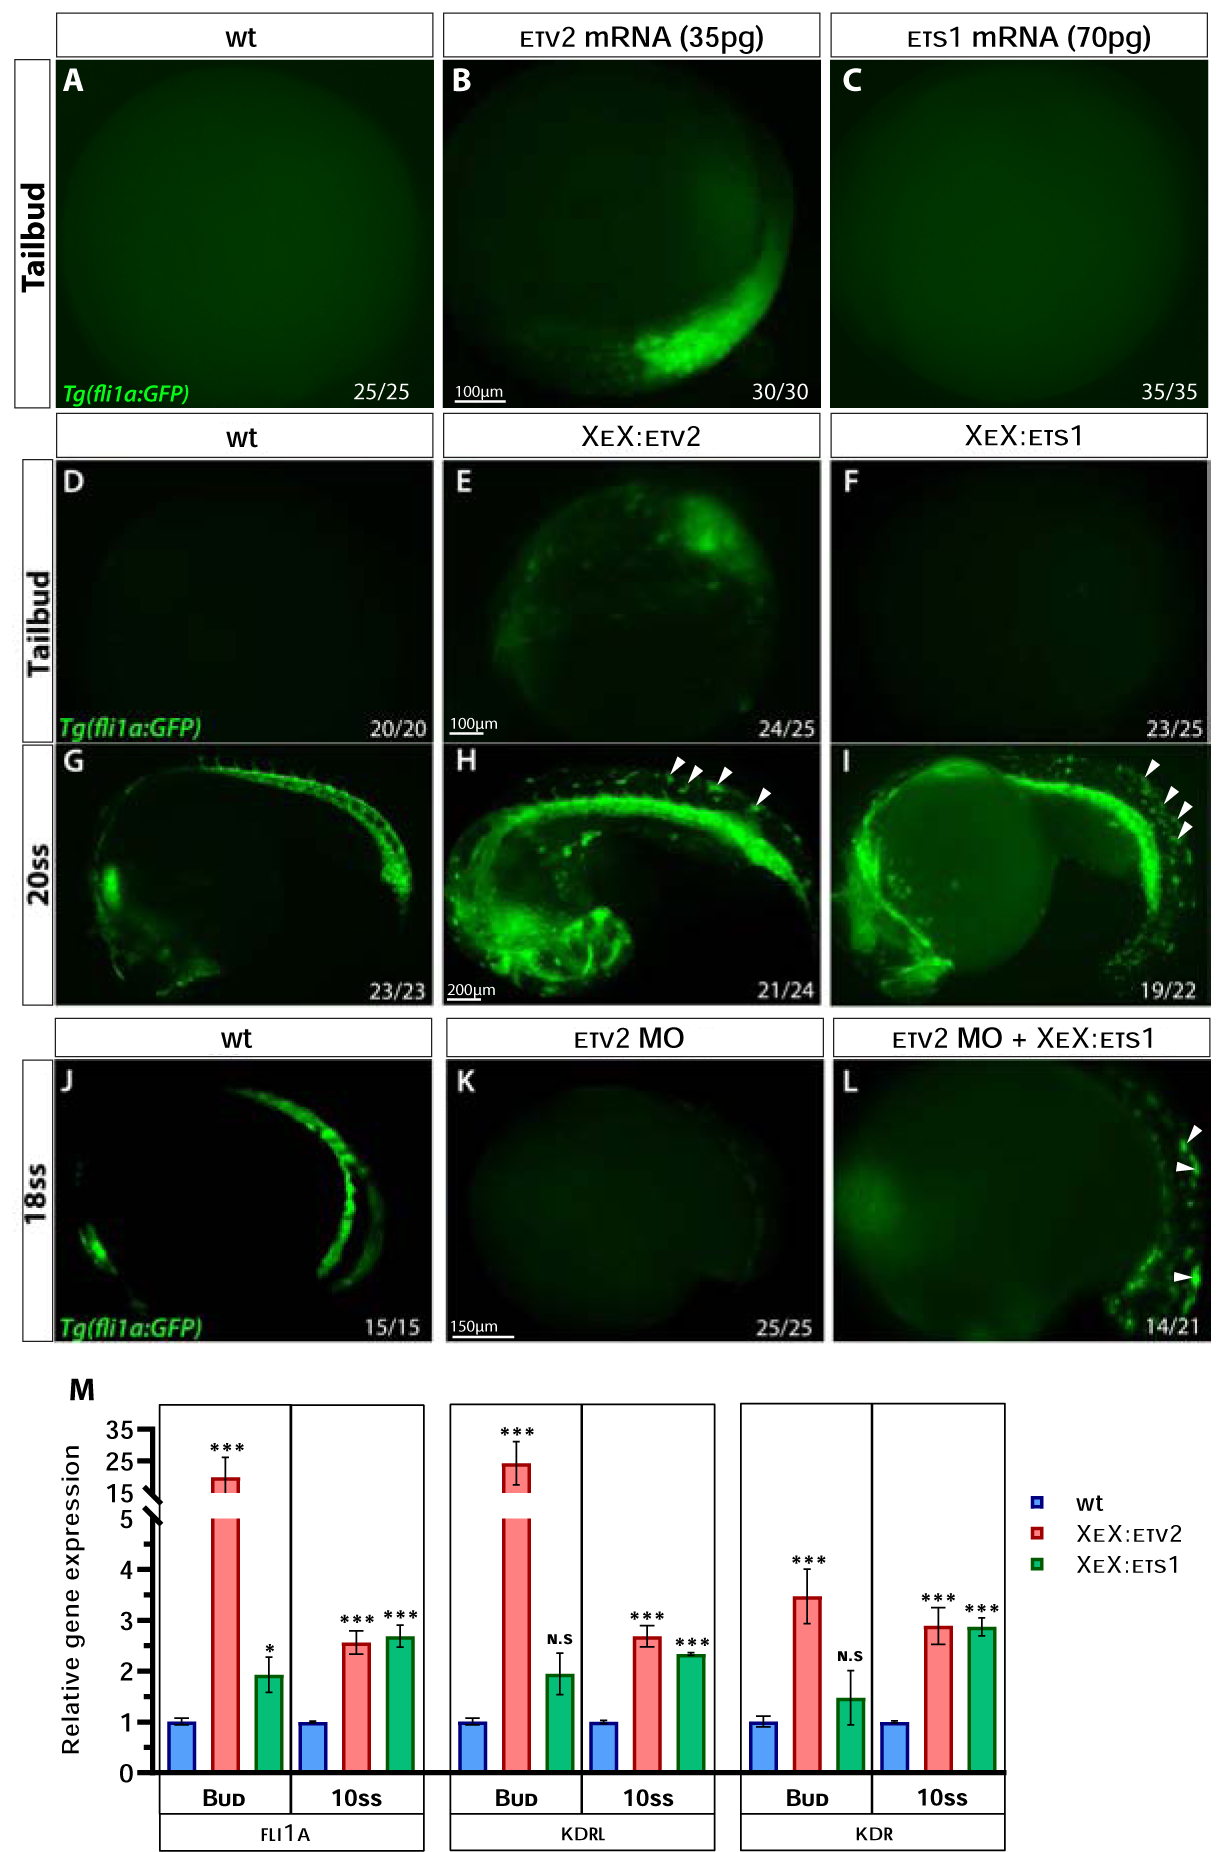
Figure 5. Ets1 exhibits delayed activity in inducing endothelial gene expression compared to Etv2.

(A-C) Compound microscope images of GFP fluorescence in Tg(fli1a:GFP) wild-type, etv2 mRNA and ets1 mRNA-injected embryos at the tailbud (10 hpf) stage. Note the GFP fluorescence in etv2 mRNA-injected embryos (B) and the lack thereof in ets1 mRNA-injected embryos (C). (D-I) GFP fluorescence in Tg(fli1a:GFP) wild-type, XeX:etv2 and XeX:ets1-injected embryos at the tailbud and 20-somite stage (19 hpf). Note the absence of GFP fluorescence in XeX:ets1 embryos at the tailbud stage (F) but presence of ectopic GFP expression at 20-somite stage as indicated by white arrowheads (I). (J-L) GFP fluorescence in Tg(fli1a:GFP) wild-type , etv2 MO and etv2 MO; XeX:ets1 embryos at 18-somite stage (18 hpf). Note the GFP expression induced by XeX:ets1 even in the absence of Etv2 function (L). (M) qPCR of wildtype, XeX:etv2 and XeX:ets1 whole embryos at the tailbud and 10-somite stage. *P<0.05, **P<0.01 (P value was calculated between wt and injected embryos); n.s – not significant; error bars represent ± SEM.
