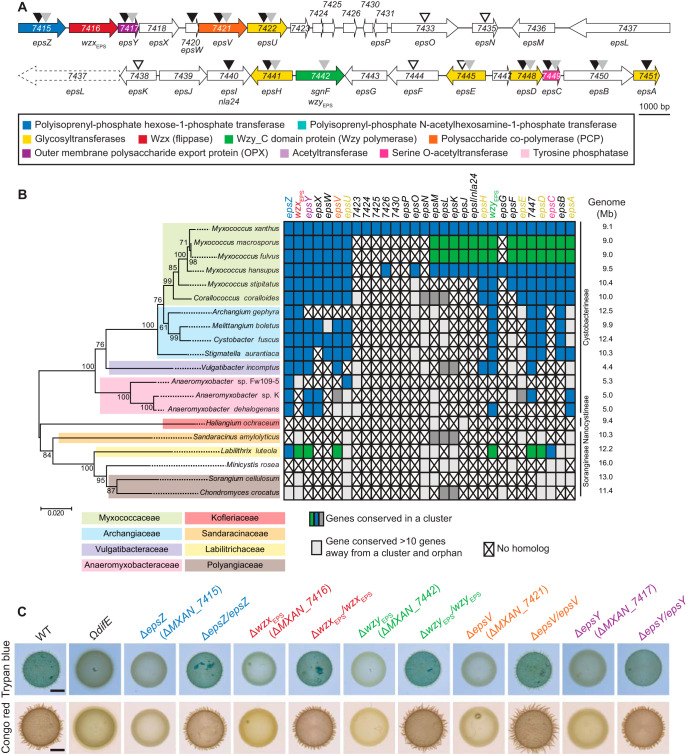
FIG 2.
Bioinformatics and genetic analysis of the eps locus. (A) eps locus in M. xanthus. Genes are drawn to scale, and MXAN number or gene name is indicated (Table S1). The color code indicates predicted functions as indicated in the key and is used throughout. Black, gray, and white arrowheads indicate mutations previously reported to cause a defect in EPS synthesis (9, 22, 34, 36), a defect in T4P-dependent motility but with no test of EPS synthesis (42), and no effect on EPS synthesis (9), respectively. (B) Taxonomic distribution and synteny of eps genes in Myxococcales with fully sequenced genomes. A reciprocal best BLASTP hit method was used to identify orthologs. (Left) 16S rRNA tree of Myxococcales with fully sequenced genomes. (Right) Genome size and family and suborder classification are indicated. To evaluate gene proximity and cluster conservation, 10 genes was considered the maximum distance for a gene to be in a cluster. Genes found in the same cluster (within a distance of <10 genes) are marked with the same color (i.e., blue, green, and dark gray). Light gray indicates a conserved gene that is found somewhere else on the genome (>10 genes away from a cluster); a cross indicates no homolog found. (C) Determination of EPS synthesis. Twenty-microliter aliquots of cell suspensions of strains of the indicated genotypes at 7 × 10⁹ cells ml−1 were spotted on 0.5% agar supplemented with 0.5% CTT and Congo red or trypan blue and incubated for 24 h. In the complementation strains, the complementing gene was expressed ectopically from the native (epsZ, wzxEPS, and wzyEPS) or pilA promoter on a plasmid integrated in a single copy at the Mx8 attB site. The ΩdifE mutant served as a negative control.

