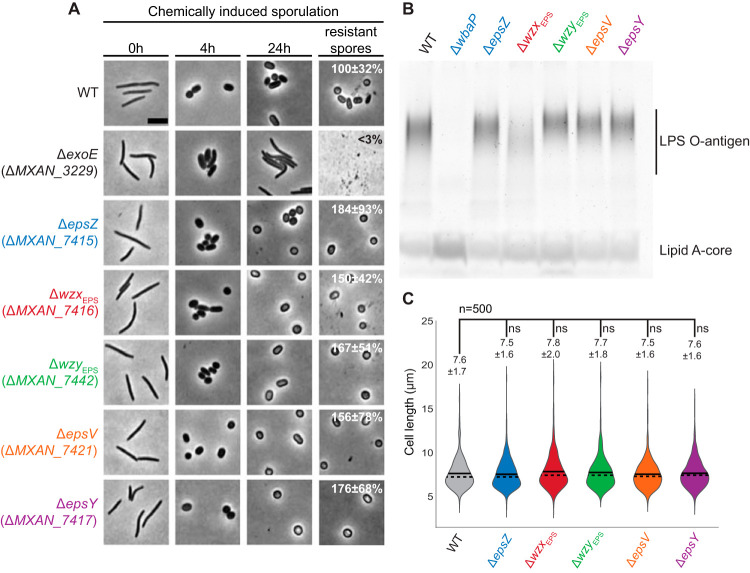
FIG 4.
Phenotypic characterization of the Δeps mutants. (A) Chemically induced sporulation. Sporulation was induced by addition of glycerol to a final concentration of 0.5 M. At 0, 4, and 24 h after glycerol addition, cell morphology was documented. In images labeled resistant spores, cells were exposed to sonic and heat treatment before microscopy. Sporulation frequency after sonic and heat treatment is indicated as the mean from three biological replicates relative to the WT ± standard deviations. Scale bar, 5 μm. (B) Extracted LPS from the same number of cells was separated by SDS-PAGE and detected with Pro-Q Emerald 300. (C) Cell length measurements of the Δeps mutants. Cell length is shown in a violin plot, which indicates the probability density of the data at different cell length values. n = 500 combined from two biological replicates, and mean and median values are represented by a continuous and dashed line, respectively. Samples were compared using a Mann-Whitney test; ns, not significant.

