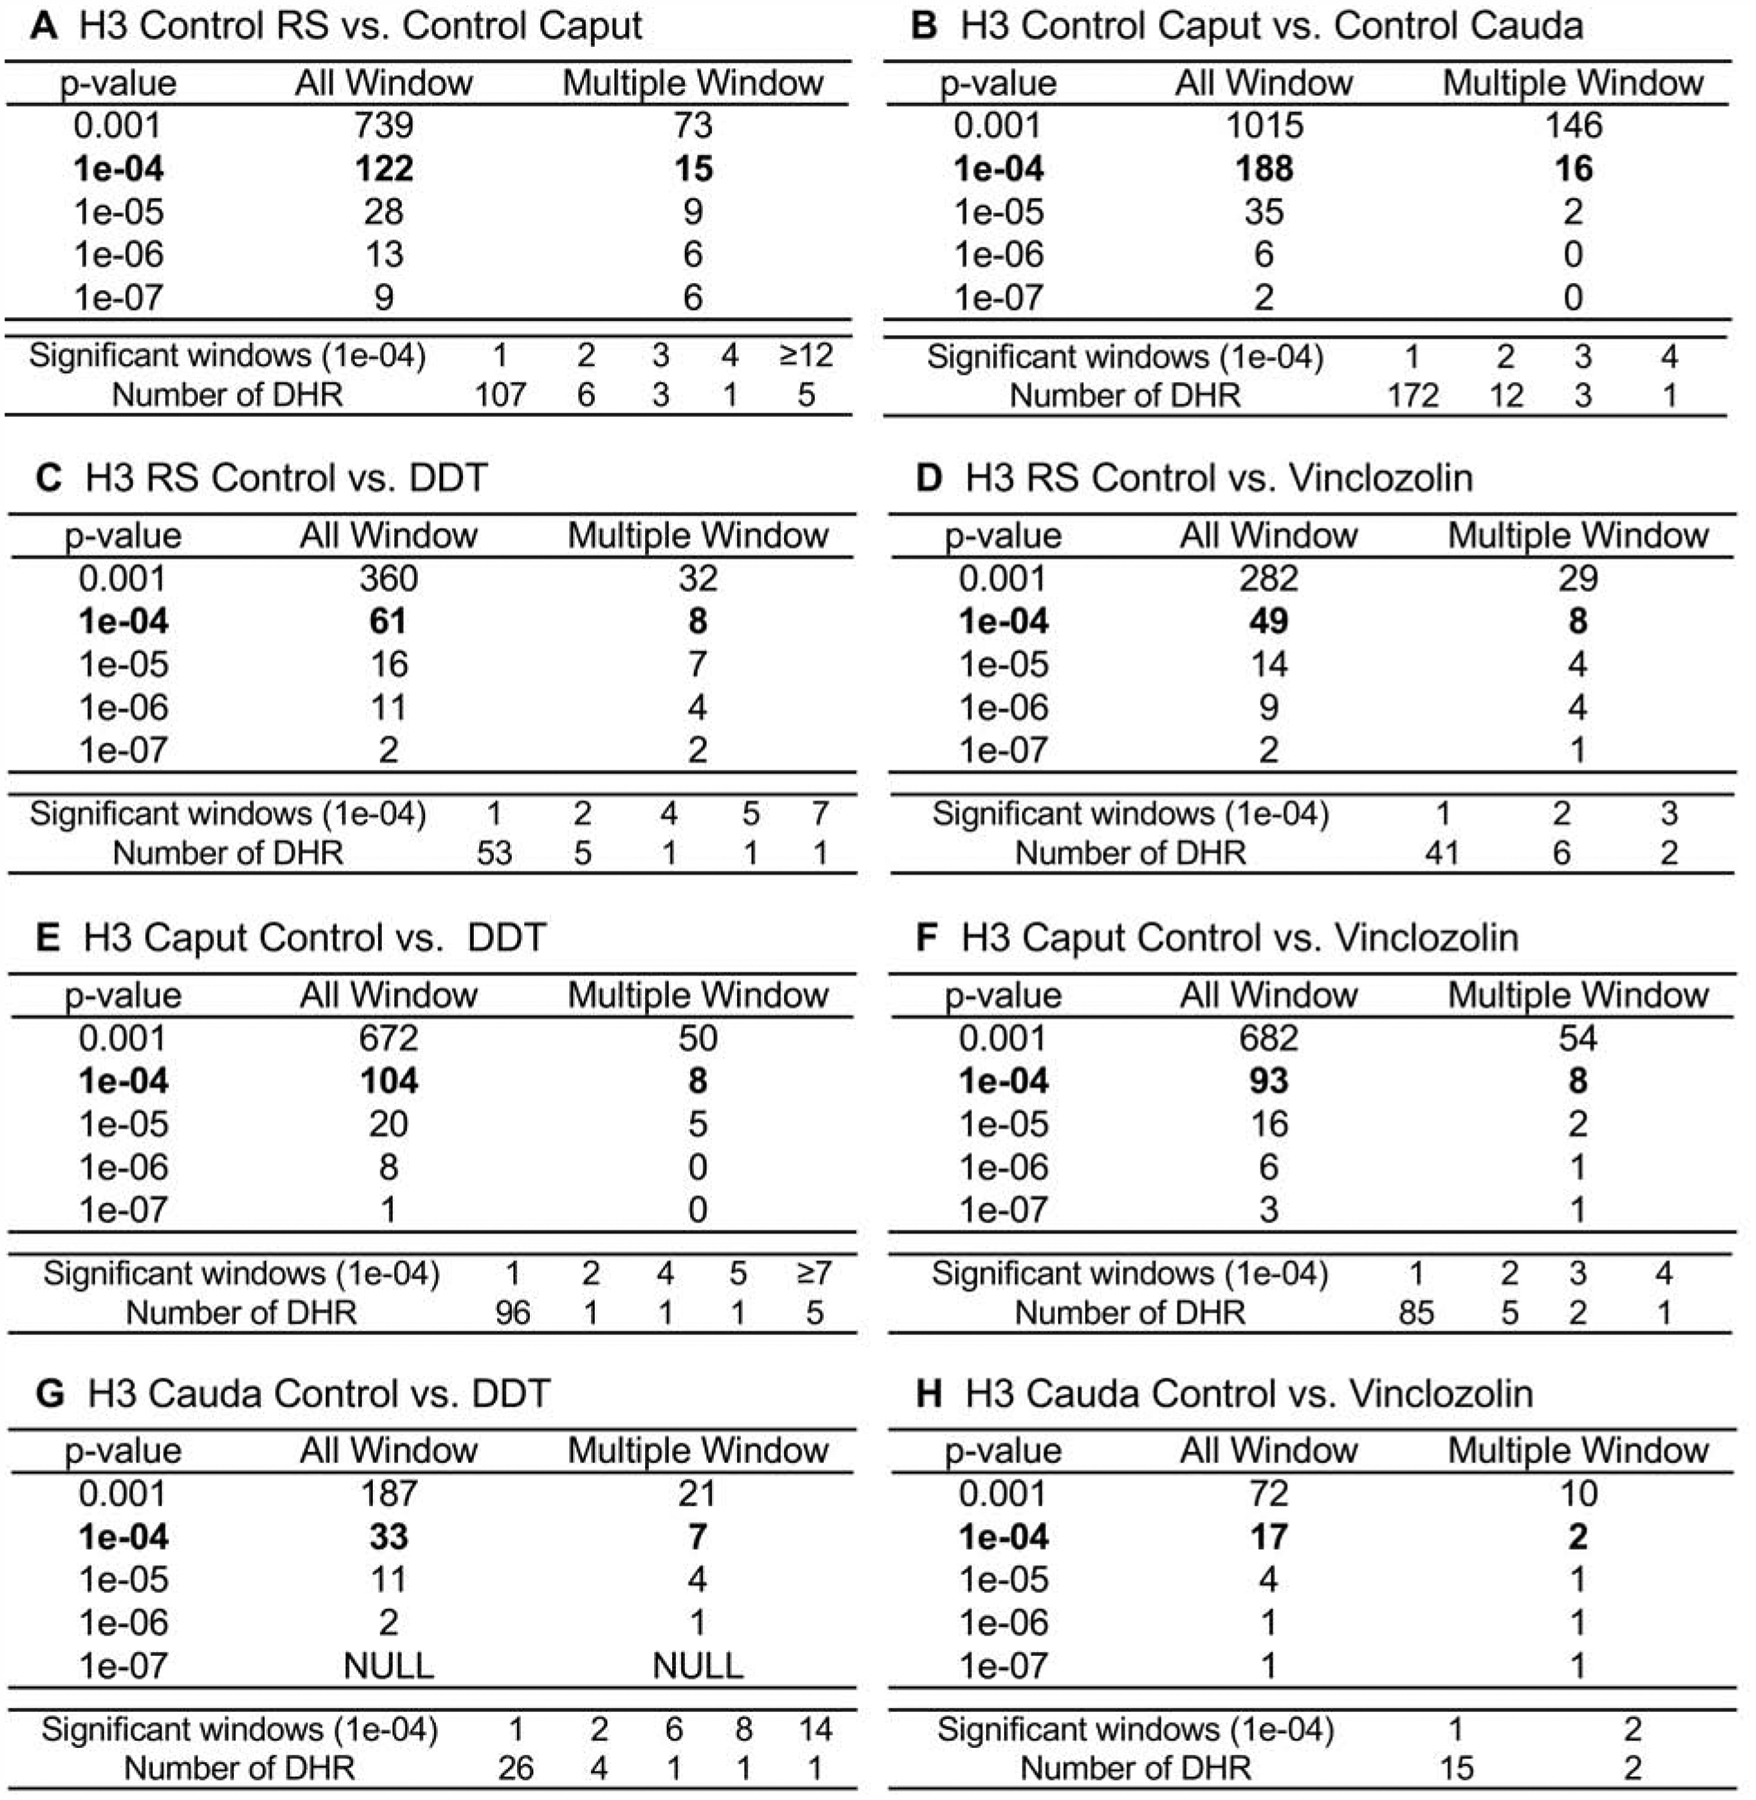
Figure 1.

DHR identification. The number of DHRs found using different p-value cutoff thresholds. The All Window column shows all 100 bp windows at the p-value to identify the DHRs. The Multiple Window column shows the number of DHRs containing at least two significant nearby 100 bp windows with the number of DHRs. The specific number of significant windows for the p-value threshold of p<1e-04 is shown. (A) H3 control lineage caput versus round spermatids. (B) H3 control lineage cauda versus caput. (C) H3 round spermatids (RS) control versus DDT. (D) H3 RS control versus vinclozolin. (E) H3 caput control versus DDT. (F) H3 caput control versus vinclozolin. (G) H3 cauda control versus DDT. (H) H3 cauda control versus vinclozolin.
