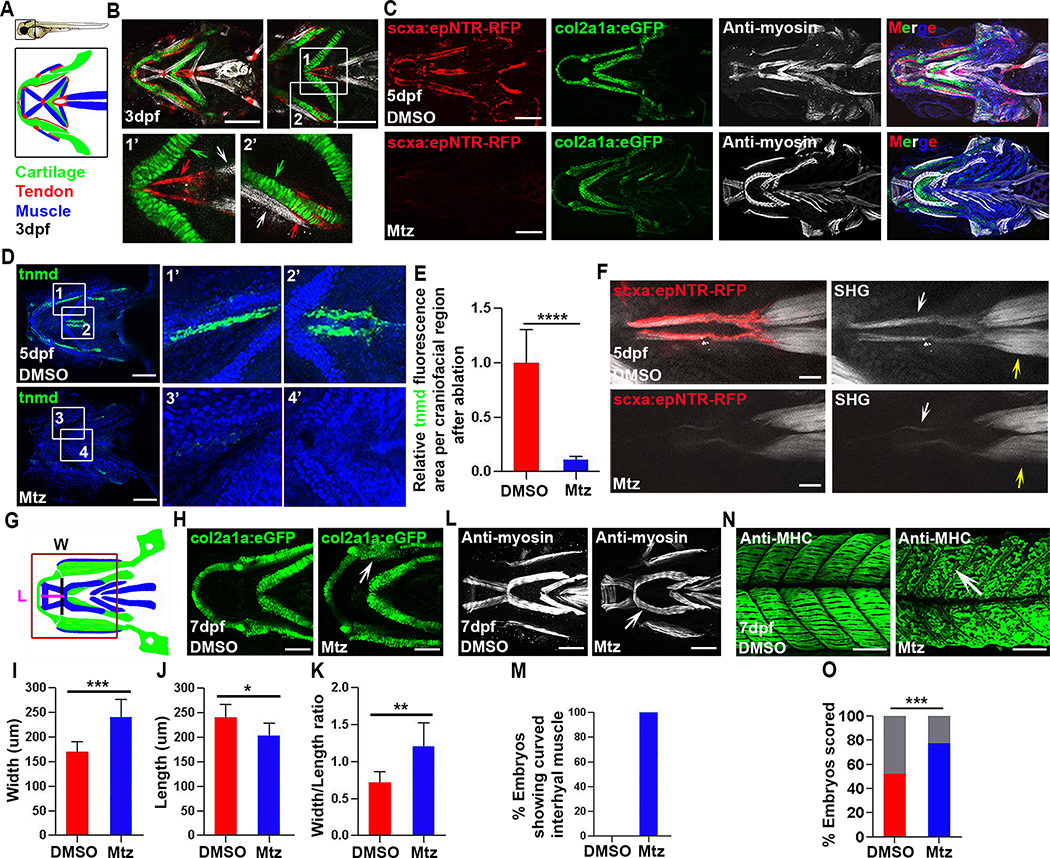
Figure 1. Tendon cell ablation disrupts the collagen matrix and cartilage and muscle morphology.
(A) Cartoons of a 3 dpf zebrafish embryo and the craniofacial muscle (Blue), tendon (Red), and cartilage (Green).
(B) Confocal images of craniofacial tendon (red), cartilage (green), and muscle (white) in Tg(scxa:gal4-vp16; uas:epNTR-RFP; col2a1a:eGFP) fish. Insets show higher magnification views of the sternohyoideus (SH) tendon region (white box 1 and 1’, red arrow, SH tendon. green arrow, ceratohyal cartilage. white arrow, SH muscle) and palatoquadrate region (white box 2 and 2’, red arrow, tendon. green arrow, palatoquadrate cartilage. white arrow, adductor mandibulae muscle).
(C) Tendon cell ablation in Tg(scxa:gal4-vp16; uas:epNTR-RFP; col2a1a: eGFP) fish. Top, unablated (DMSO). Bottom, ablated (Mtz). Blue in merged image is Hoechst staining.
(D) Fluorescent in situ for tnmd and Hoechst stained craniofacial regions in unablated (DMSO) and ablated (Mtz) embryos. White box 1, 3, 1’, 3’, palatoquadrate ligament region. White box 2, 4, 2’, 4’, SH tendon region.
(E) Quantification of tnmd fluorescence area in craniofacial region in unablated (DMSO, n=7) and ablated (Mtz, n=7) embryos. Two-tailed, unpaired Student’s t-test and data are mean ± s.d. ****, p<0.0001.
(F) Multiphoton images of SH tendons (red), fibrillar collagen (white arrow), and SH muscle (yellow arrow) in unablated (DMSO) and ablated (Mtz) embryos. SHG, second harmonic generation. Scale bar, 25 μm.
(G) Cartoon illustrating craniofacial region, ventral view with lines indicating areas used to measure width (W) and length (L) Red box shows the area analyzed in (H).
(H) Higher magnification views of lower jaw cartilage in control Tg(col2a1a: eGFP) (DMSO) and ablated (Mtz) embryos. White arrow, dysmorphic palatoquadrate cartilage.
(I-K) Quantification of width (I), length (J), and width/length ratio (K) for lower jaw cartilage in unablated (DMSO, n=8) and ablated (Mtz, n=8) embryos. Two-tailed, unpaired Student’s t-test and data are mean ± s.d. *, p<0.05. **, p<0.01. ***, p<0.001.
(L) Ventral views of craniofacial muscle in unablated (DMSO) and ablated (Mtz) embryos. White arrow, curved interhyal muscle.
(M) Percentage of embryos showing a curved interhyal muscle phenotype in unablated (DMSO, n=5, 0%) and ablated (Mtz, n=4, 100%) embryos.
(N) Confocal images of axial muscle in unablated (DMSO) and ablated (Mtz) embryos. White arrow, detached muscle.
(O) Percentage of embryos showing attachment and detachment phenotypes in unablated (DMSO, n=109) and ablated (Mtz, n=110) embryos. Grey bars show percentages of muscle fibers that remain attached in both conditions. Red and blue bars showed percentages of muscle fibers that detached in both conditions. Chi-squared test. ***, p<0.001.
dpf, days post fertilization. All images, anterior to the left. All scale bars are 100μm, except in (F) where noted. Tendon cell was ablated with Mtz at 3–5 dpf.
See also Figures S1 and S2

