
Figure 2. Getis-Ord Gi* cluster detection of ‘cold’ and ‘hot spots’a for treatment availability in relation to county opioid overdose mortality.
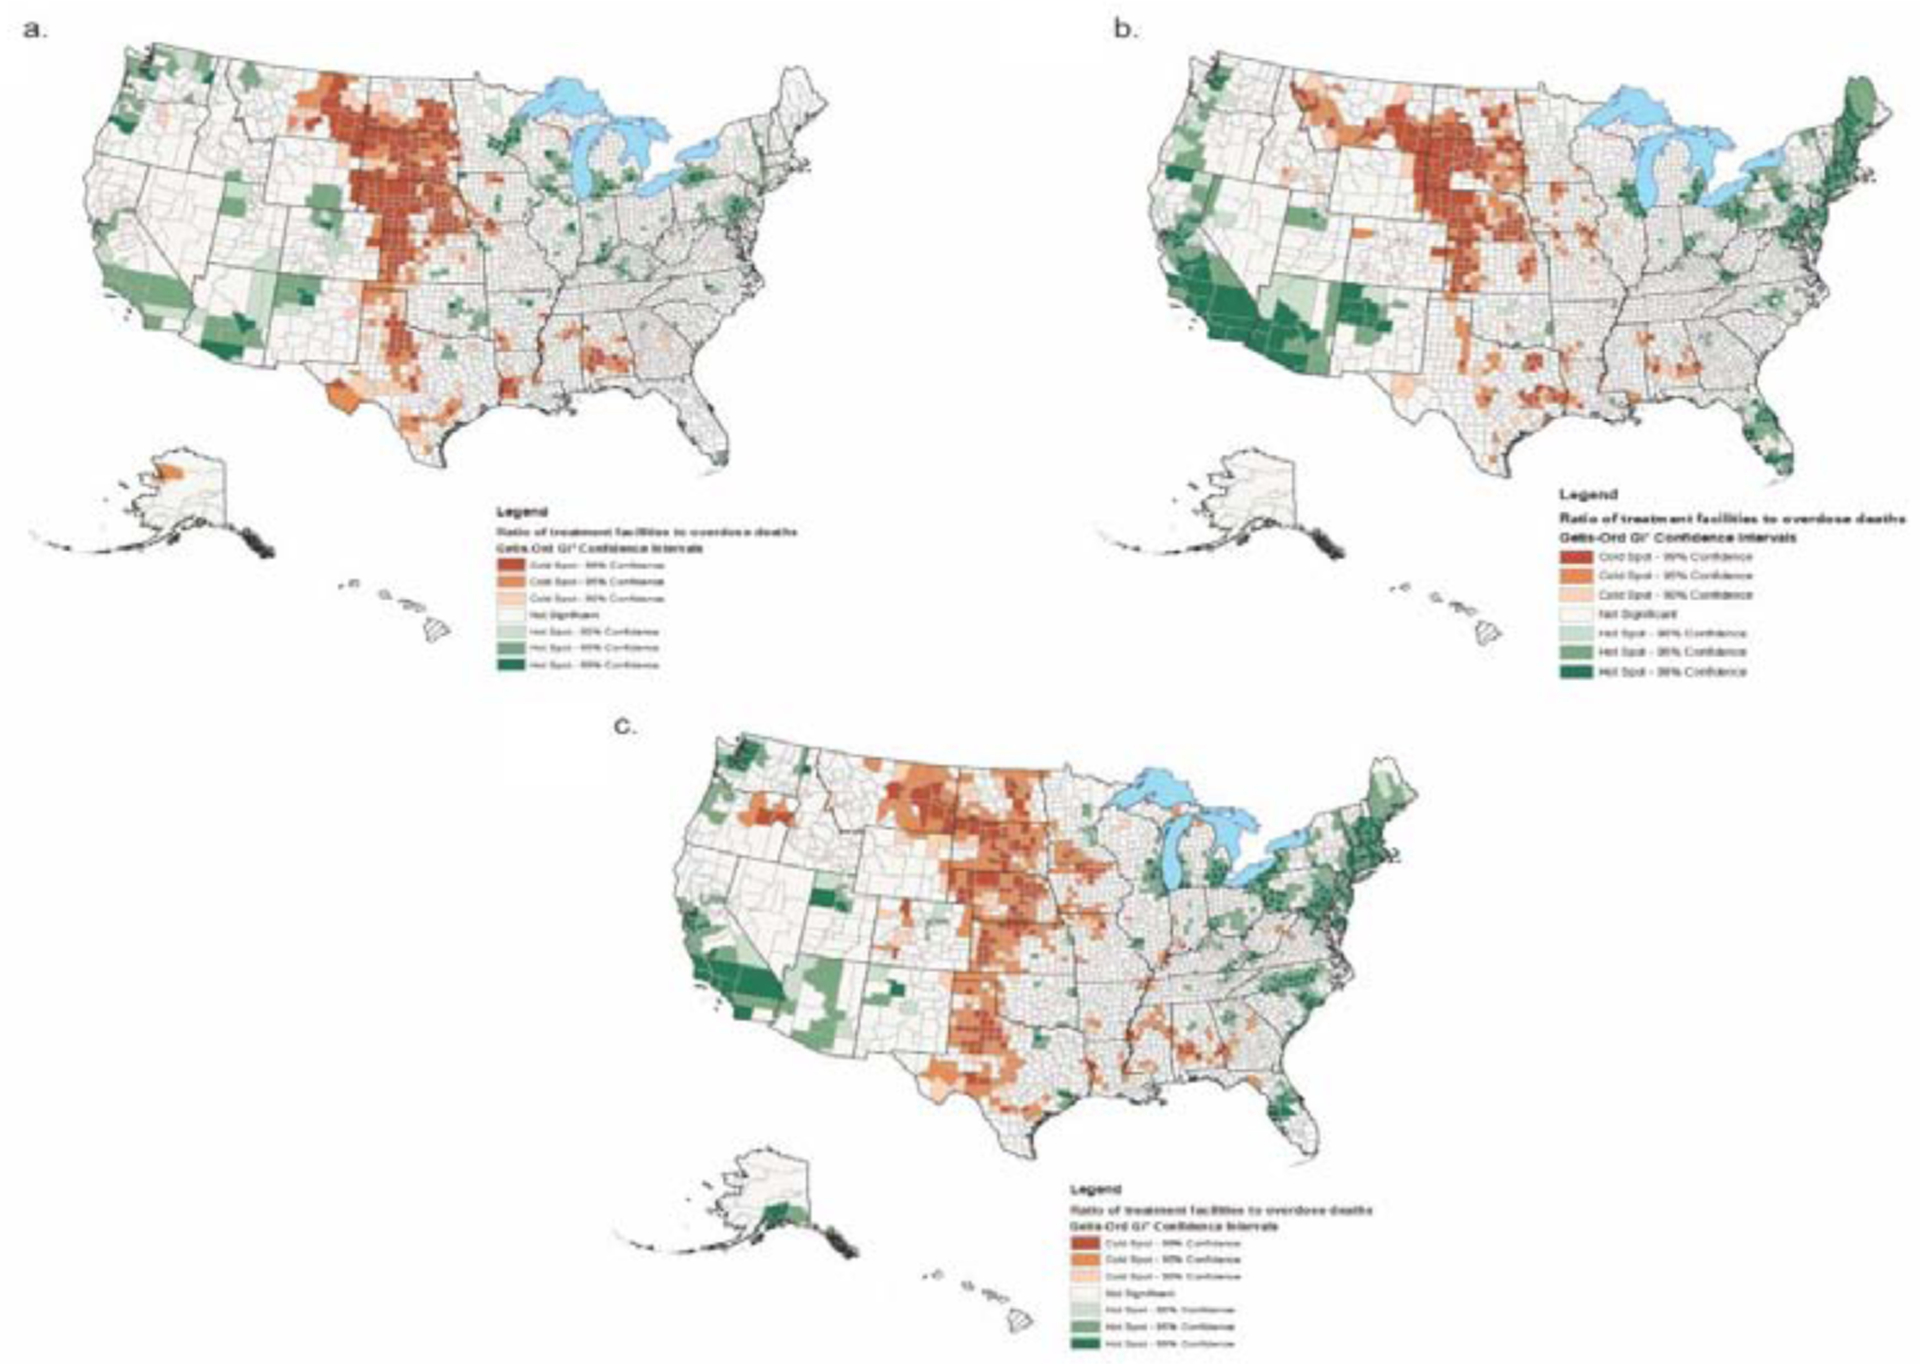
(A) Any facilityb; (B) Facilities offering programs for veteransc; (C) Facilities offering programs for pregnant and postpartum women.d
a’Cold’ and ‘hot spots’ are clusters of contiguous counties that collectively had ratios of treatment facilities per capita to local overdose mortality below and above the national median, respectively.
bFacilities and mortality rates per 100,000 individuals aged ≥11 years.
cFacilities and mortality rates per 100,000 veterans.
dFacilities and mortality rates per 100,000 women aged 15–44 years.