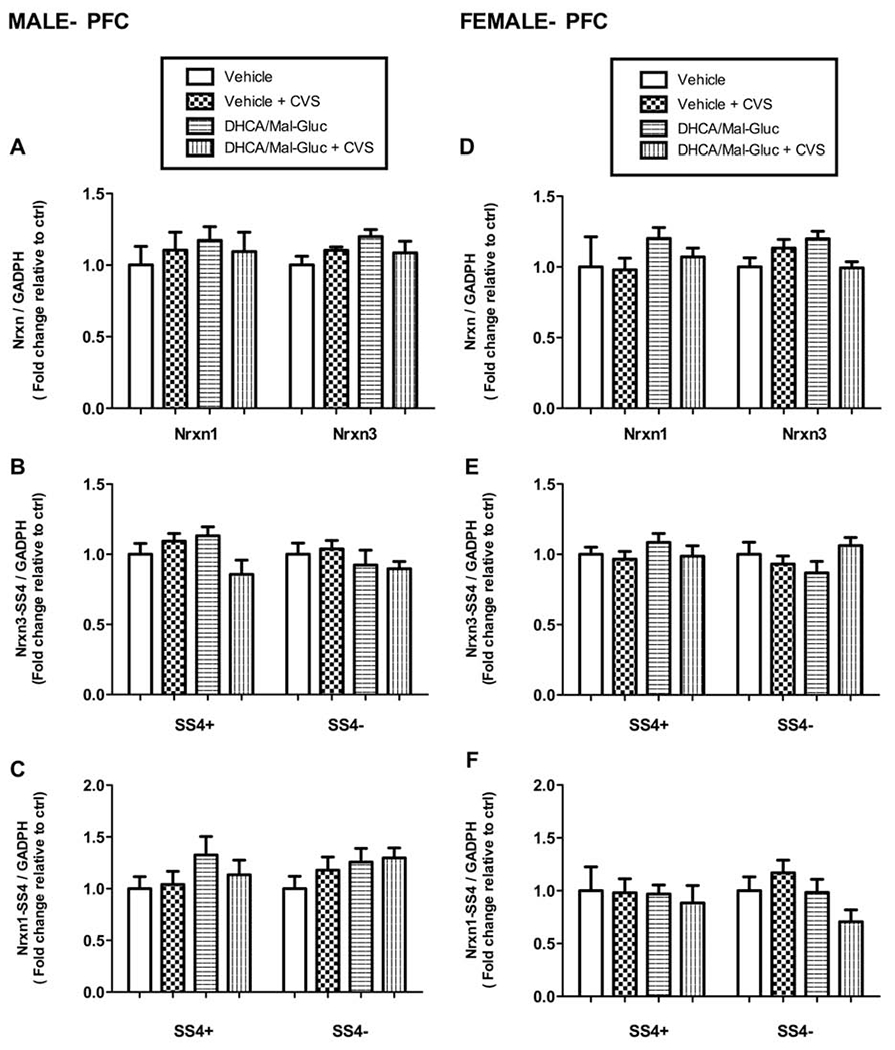
Fig.4-. Regulation of the expression of total Nrxn1 and 3 and alternative splicing in HIPP after Chronic Variable Stress.

(A-C) Real-time PCR quantification of total Nrxn1/3 and alternative splicing variants (splicing site 4, SS4) in the HIPP of male stressed mice with or without DHCA treatment. Fold change of (A) Nrxn1 and Nrxn3 total mRNA (B) Nrxn3 SS4+ and SS43− mRNA and (C) Nrxn1 SS4+ and SS4− mRNA in stressed male mice with or without treatment relative to the non -stressed control mice (vehicle). (D-F) Real-time PCR quantification of total Nrxn1/3 and alternative splicing variants (splicing site 4, SS4) in the HIPP of female stressed mice with or without DHCA treatment. Fold change of (D) Nrxn1 and Nrxn3 total mRNA (E) Nrxn3 SS4+ and SS43− mRNA and (F) Nrxn1 SS4+ and SS4− mRNA in stressed female mice with or without treatment relative to non -stressed control mice (vehicle). Female mice, One-way ANOVA: F 3,35 =56.11 , P < 0.0001 for NRX1; F 3,35 =18.37 , P < 0.0001 for Nrxn1 SS4+; F 3,34 = 8.89 , P= 0.0004 for Nrxn1 SS4−; F 3,37= 10.29 , P =0.0001 for Nrxn3; F 3,28 = 15.45, P < 0.0001 for Nrxn3 SS4+; F 3,40 =0.79 , P= 0.46 for Nrxn3 SS4−. Male mice, One-way ANOVA: F 3,33 = 2.34,P= 0,092 for NRX1; F 3,35 =0.716, P= 0.5528 for Nrxn1 SS4+; F 3,35= 2.453, P = 0.0902 for Nrxn1 SS4− ; F 3,29 =37.55, P < 0.0001 for Nrxn3; F 3,39= 10.74, P < 0.0001 for Nrxn3 SS4+ ; F 3,40 =49.07, P < 0.0001 for Nrxn3 SS4−). Nrxn mRNA values were normalized vs GADPH as internal control and expressed as fold changes relative to non-treated controls (vehicle). Bar graphs represents Mean ± S.E.M.( *P <0.05; **P <0.01, ***P <0.001; n=8-10 animals/group).
