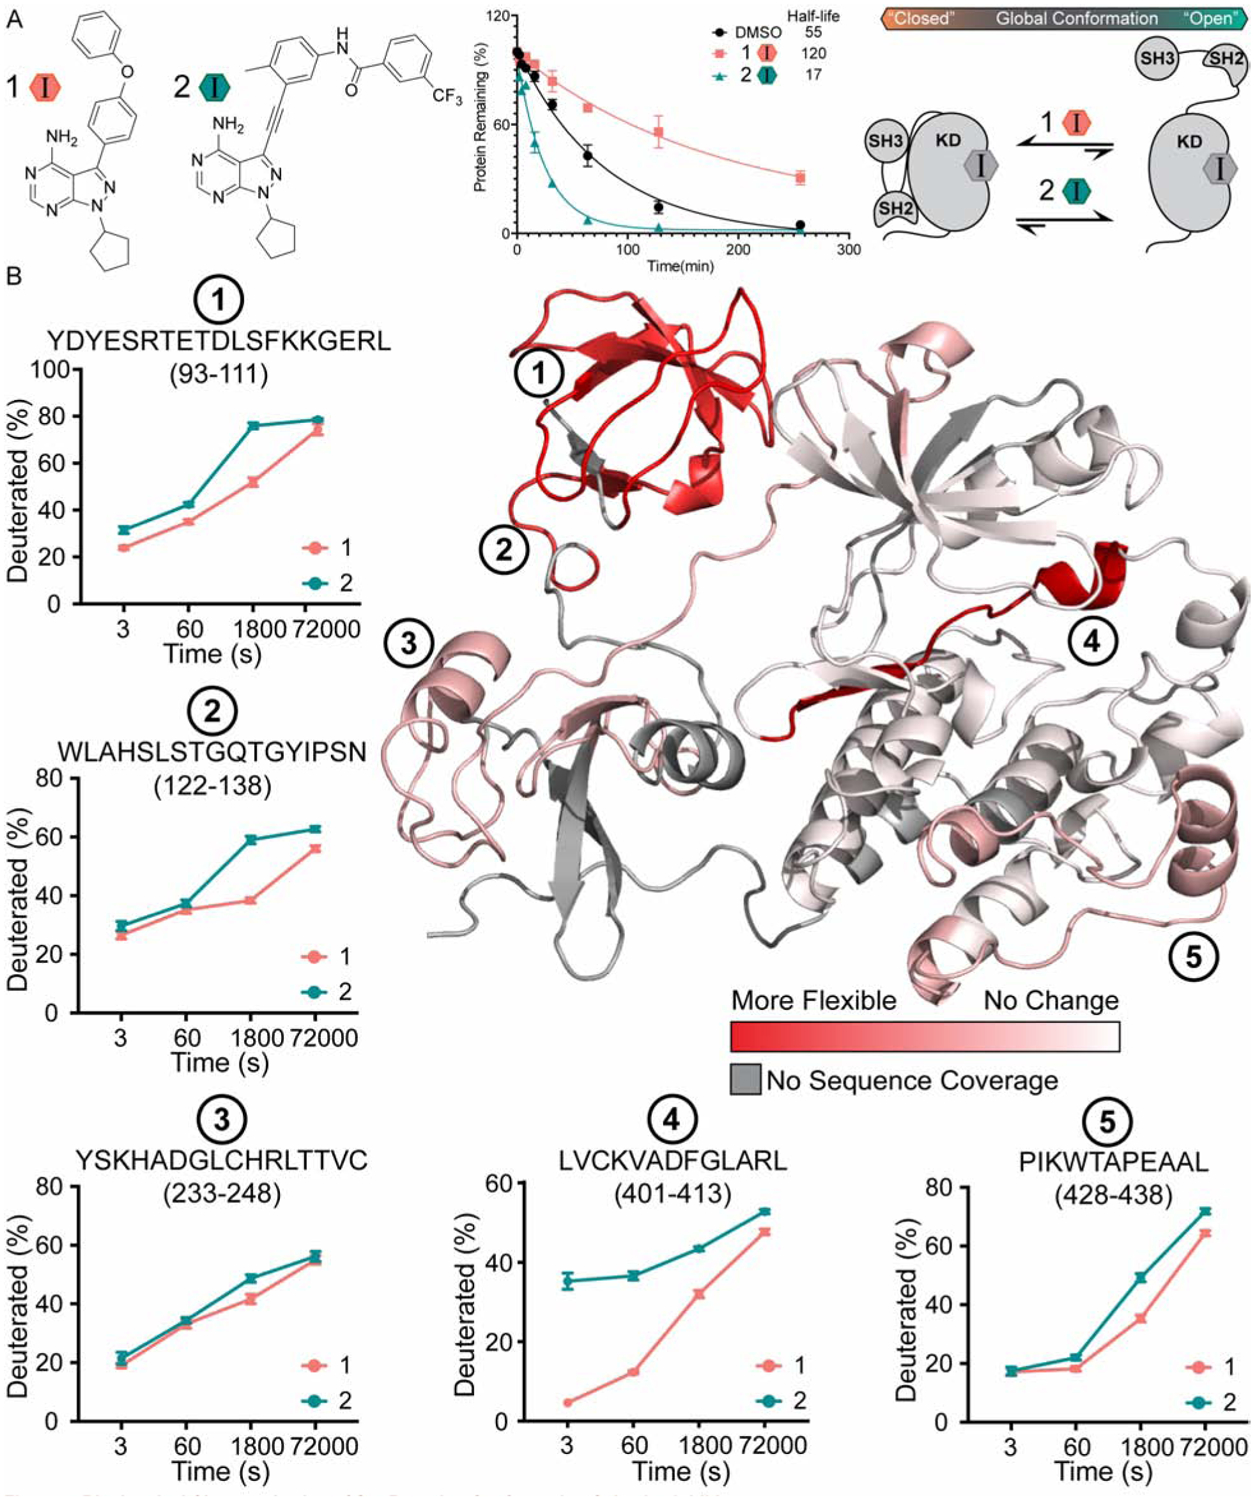
Figure 4. Biochemical Characterization of Inhibitor-Bound Src 3D Complexes.

(A) Structures of inhibitors 1 and 2 (Krishnamurty et al., 2013; Fang et al., 2020). Quantification of the limited proteolysis experiments performed with inhibitor-bound complexes of Src 3D. Points represent mean ± SEM. (B) HDX-MS analysis of inhibitor-bound Src 3D complexes. Deuteration differences between the inhibitor 1- and 2-Src 3D complexes are plotted on the crystal structure of Src 3D (PDB: 2SRC) from no change (white) to the largest change (red). Deuterium uptake plots for peptides at regions of interest are shown on the periphery. Points represent mean ± SEM.
