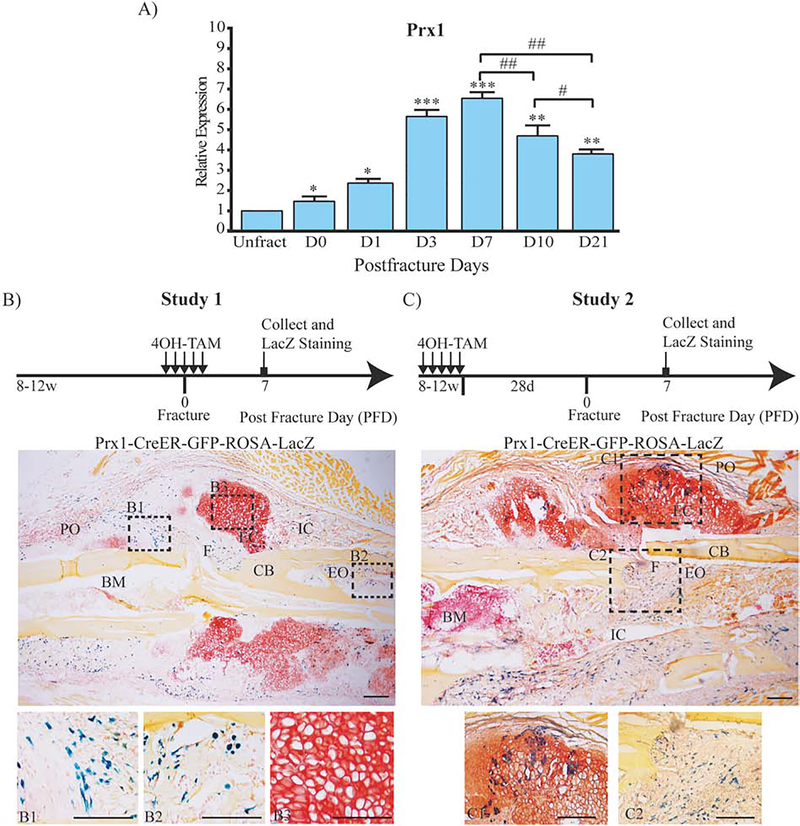
Figure 1.
Temporal expression pattern of Prx1 in fracture healing.
(A) mRNA expression levels of Prx1 in fractured Prx1-CreER-GFP mice quantified by qRT-PCR. Data are reported as mean ± SD of triplicate assays, each with n=10 separate samples normalized to unfractured (Unfract). *, p < 0.05, **, p < 0.01, ***, p < 0.001, compared to Unfract by one-way ANOVA and Sidak’s multiple comparison test. #, p < 0.05, ##, p < 0.01, by unpaired two-tail t-test. (B) Representative histological LacZ/Safranin O/Orange G staining for cell lineage tracing Study 1 and Study 2 (C) in Prx1-CreER-GFP-ROSA-LacZ mice. Dotted squares indicate areas magnified in B1, B2, B3, C1 and C2. PO= periosteum; F= fracture line; CB= cortical bone; EO= endosteum; BM= bone marrow; EC= endochondral callus; IC= intramembranous callus. Scale bars = 100μm.

