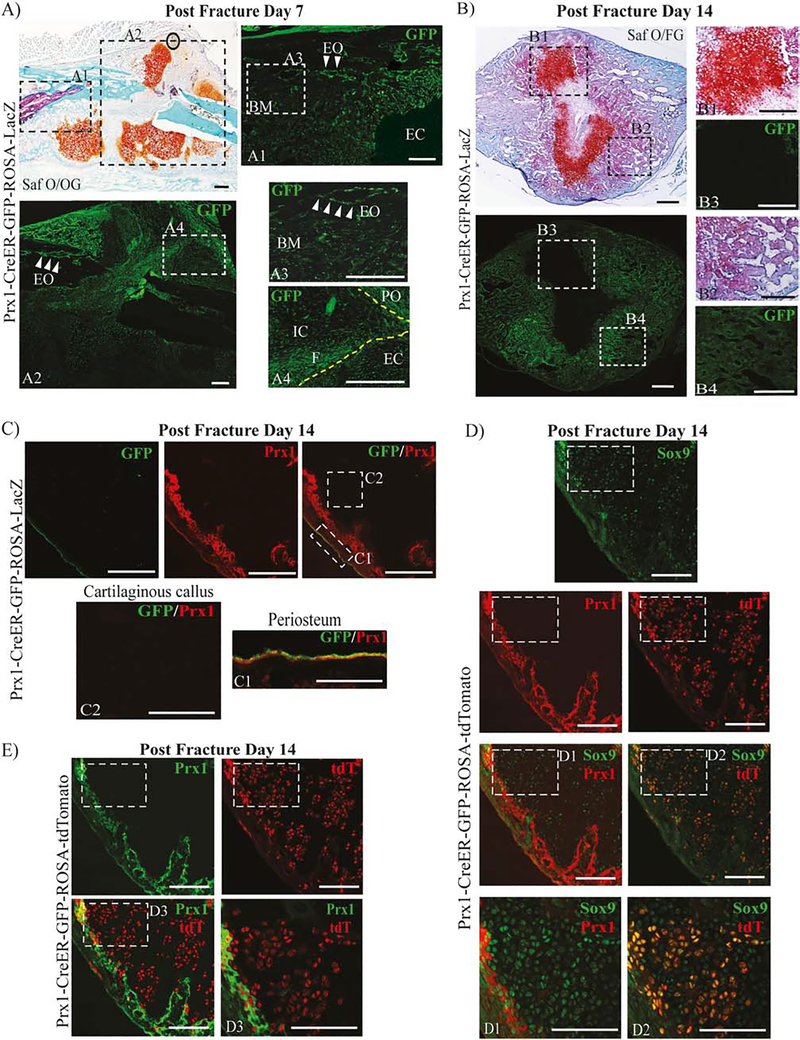
Figure 2.
Expression pattern of Prx1-expressing cells within the repairing fracture sites.
(A) Representative histological Safranin O/Orange G (Saf O/OG) staining of fractured Prx1-CreER-GFP mice at 7 days after fracture. Dotted squares indicate areas magnified of adjacent frozen section stained with GFP antibody (green). White arrows indicate GFP+ cells localized within the endosteum site. See text for more details. (B) Representative histological Saf O/FG staining of fractured Prx1-CreER-GFP mice at 14 days after fracture. See text for more details. Dotted squares indicate areas magnified of adjacent frozen section stained with GFP antibody (green). (C) Representative IF images of fractured Prx1-CreER-GFP mice at 14 days after fracture, immunostained with GFP (green) and Prx1 (red) antibodies. Dotted squares indicate areas magnified in periosteum, C1, and cartilaginous callus, C2. (D) Representative IF images of fractured Prx1-CreER-GFP-ROSA-tdTomato mice at 14 days after fracture, immunostained with Prx1 (red) and Sox9 (green) antibodies. The genetically-labeled tdT cells are shown in red. Dotted squares indicate area magnified in D1, D2 and D3. (E) Representative IF images of fractured Prx1-CreER-GFP-ROSA-tdTomato mice at 14 days after fracture, stained with Prx1 (green) antibody in cartilaginous callus. The genetically-labeled tdT cells are shown in red. PO= periosteum; EO= endosteum; CB= cortical bone; EC= endochondral callus; IC= intramembranous callus, BM=bone marrow. Scale bars = 100μm.

