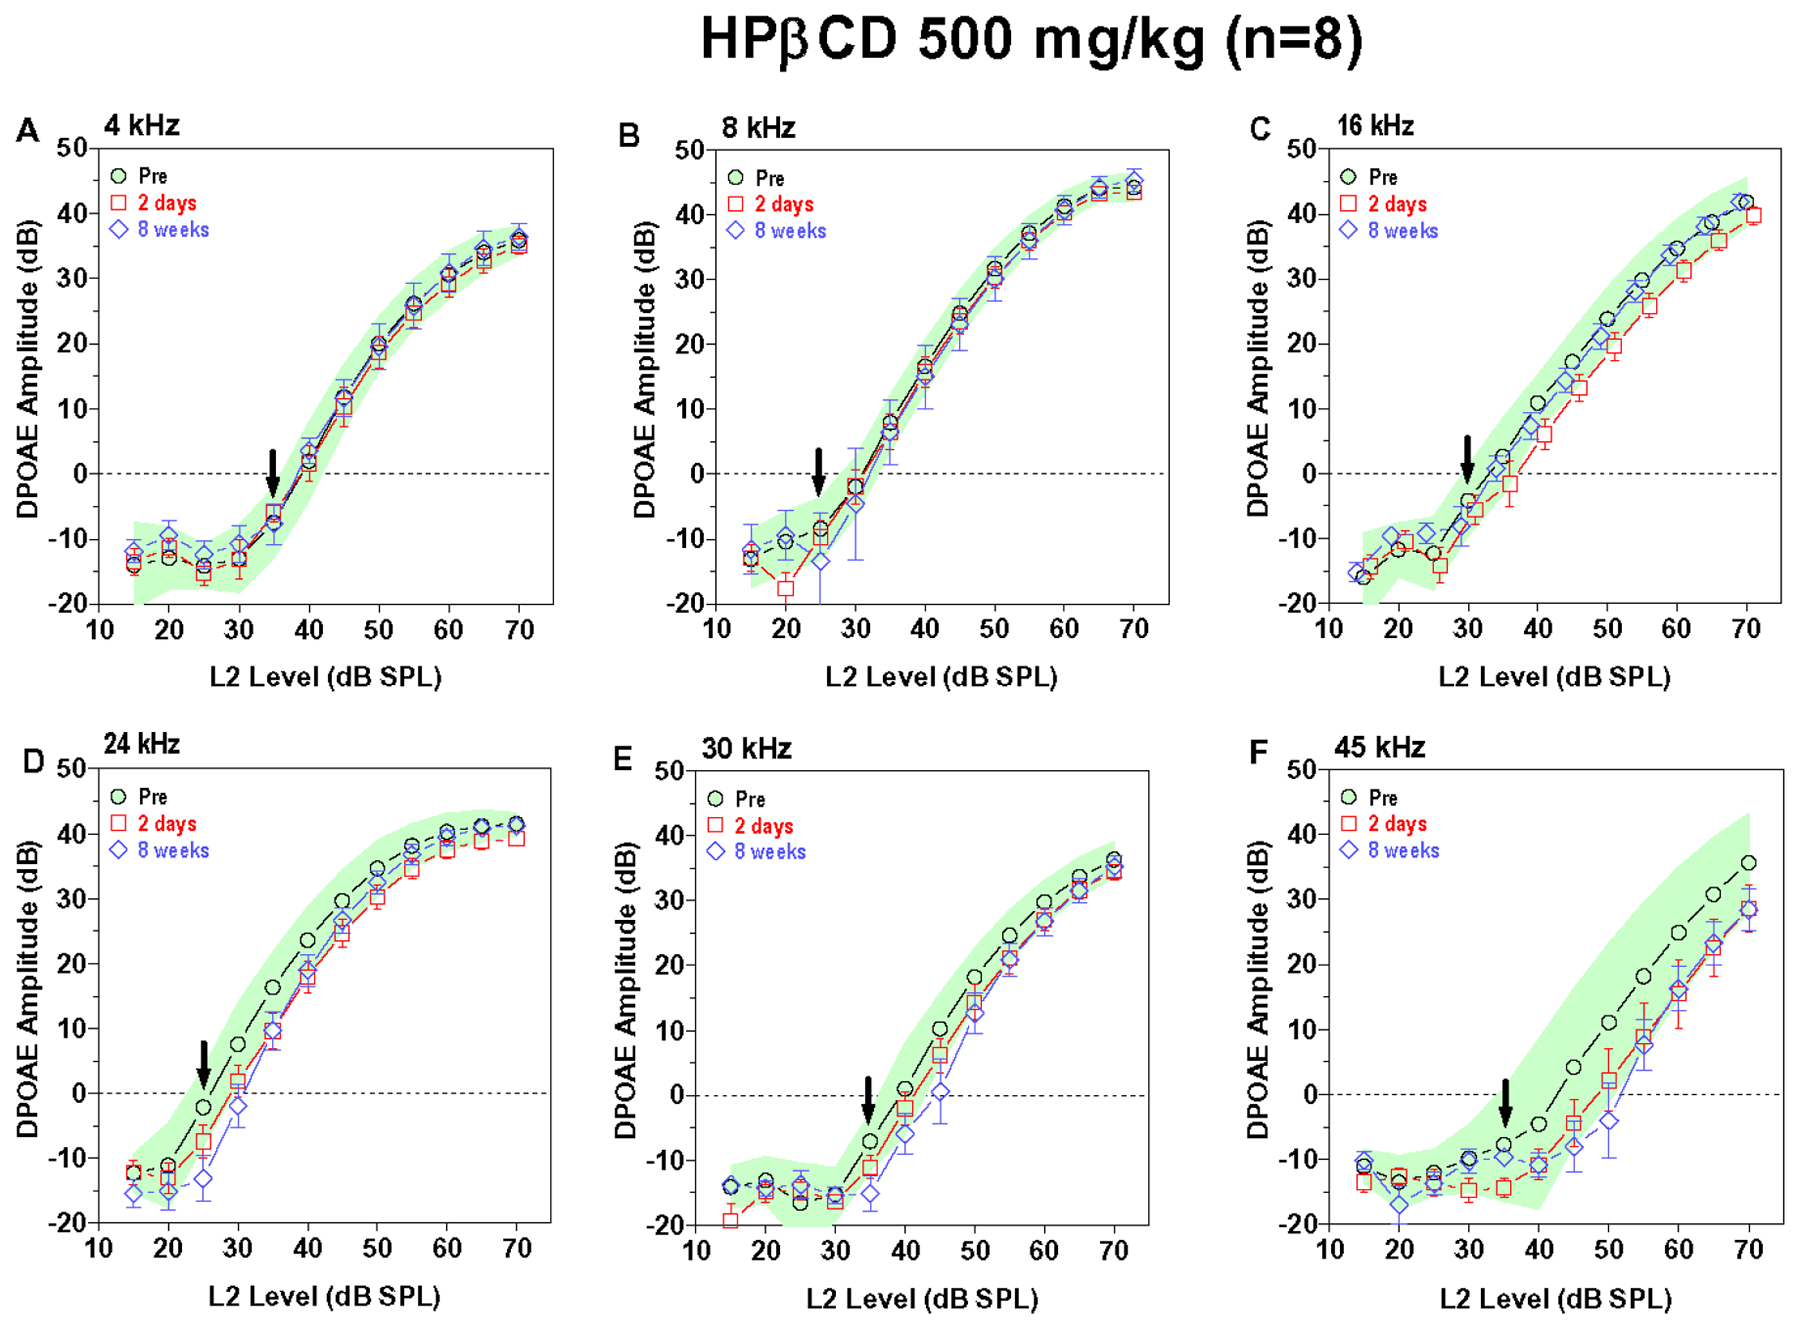
Figure 5:

Mean (n=8) DPOAE input/output function obtained pre-treatment (shaded area: 95% confidence interval) and two days (+/−SEM) and eight weeks (+/− SEM) post treatment. DPOAE input/output functions at f2 frequencies of (A) 4 kHz, (B) 8 kHz, (C) 16 kHz, (D) 24 kHz, (E) 30 kHz and (F) 45 kHz. (E-F) DPOAE amplitudes at 24, 30 and 45 kHz within or slighly below the 95% pre-treatment confidence interval at two days and eight weeks post-treatment. (A-C) DPOAE amplitudes at 4, 8 and 16 kHz similar to pre-treatment values at two days and eight weeks post-treatment.
