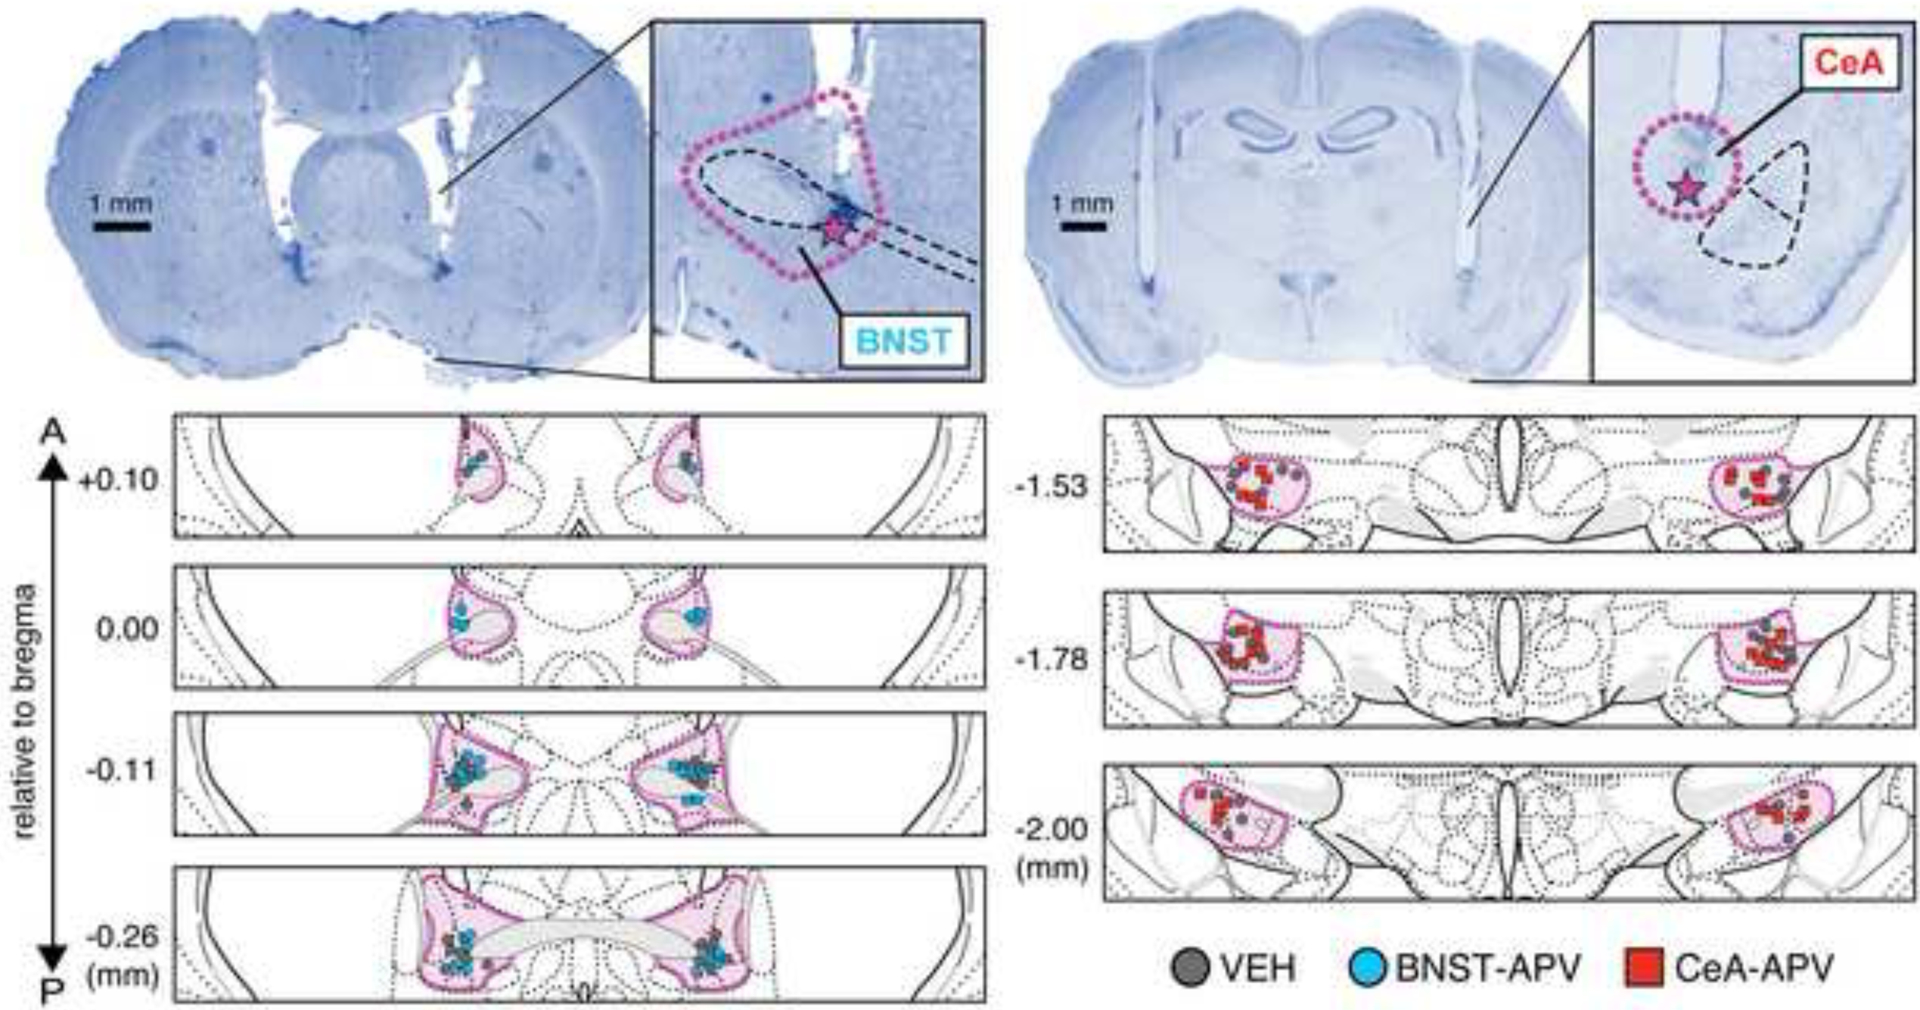
Figure 2. Cannula placements.

Representative photomicrographs of thionin-stained coronal sections (40 μm) with bilateral cannula placements aimed at the BNST (A) or CeA (B). Purple dotted lines indicate the approximate borders of the BNST and CeA, respectively. Purple stars denote the location of the injector tip of the cannula tract in the representative tissue. Symbols correspond to injector tips of each animal included in the final analyses. Atlas figures are adapted from (Swanson, 2018).
