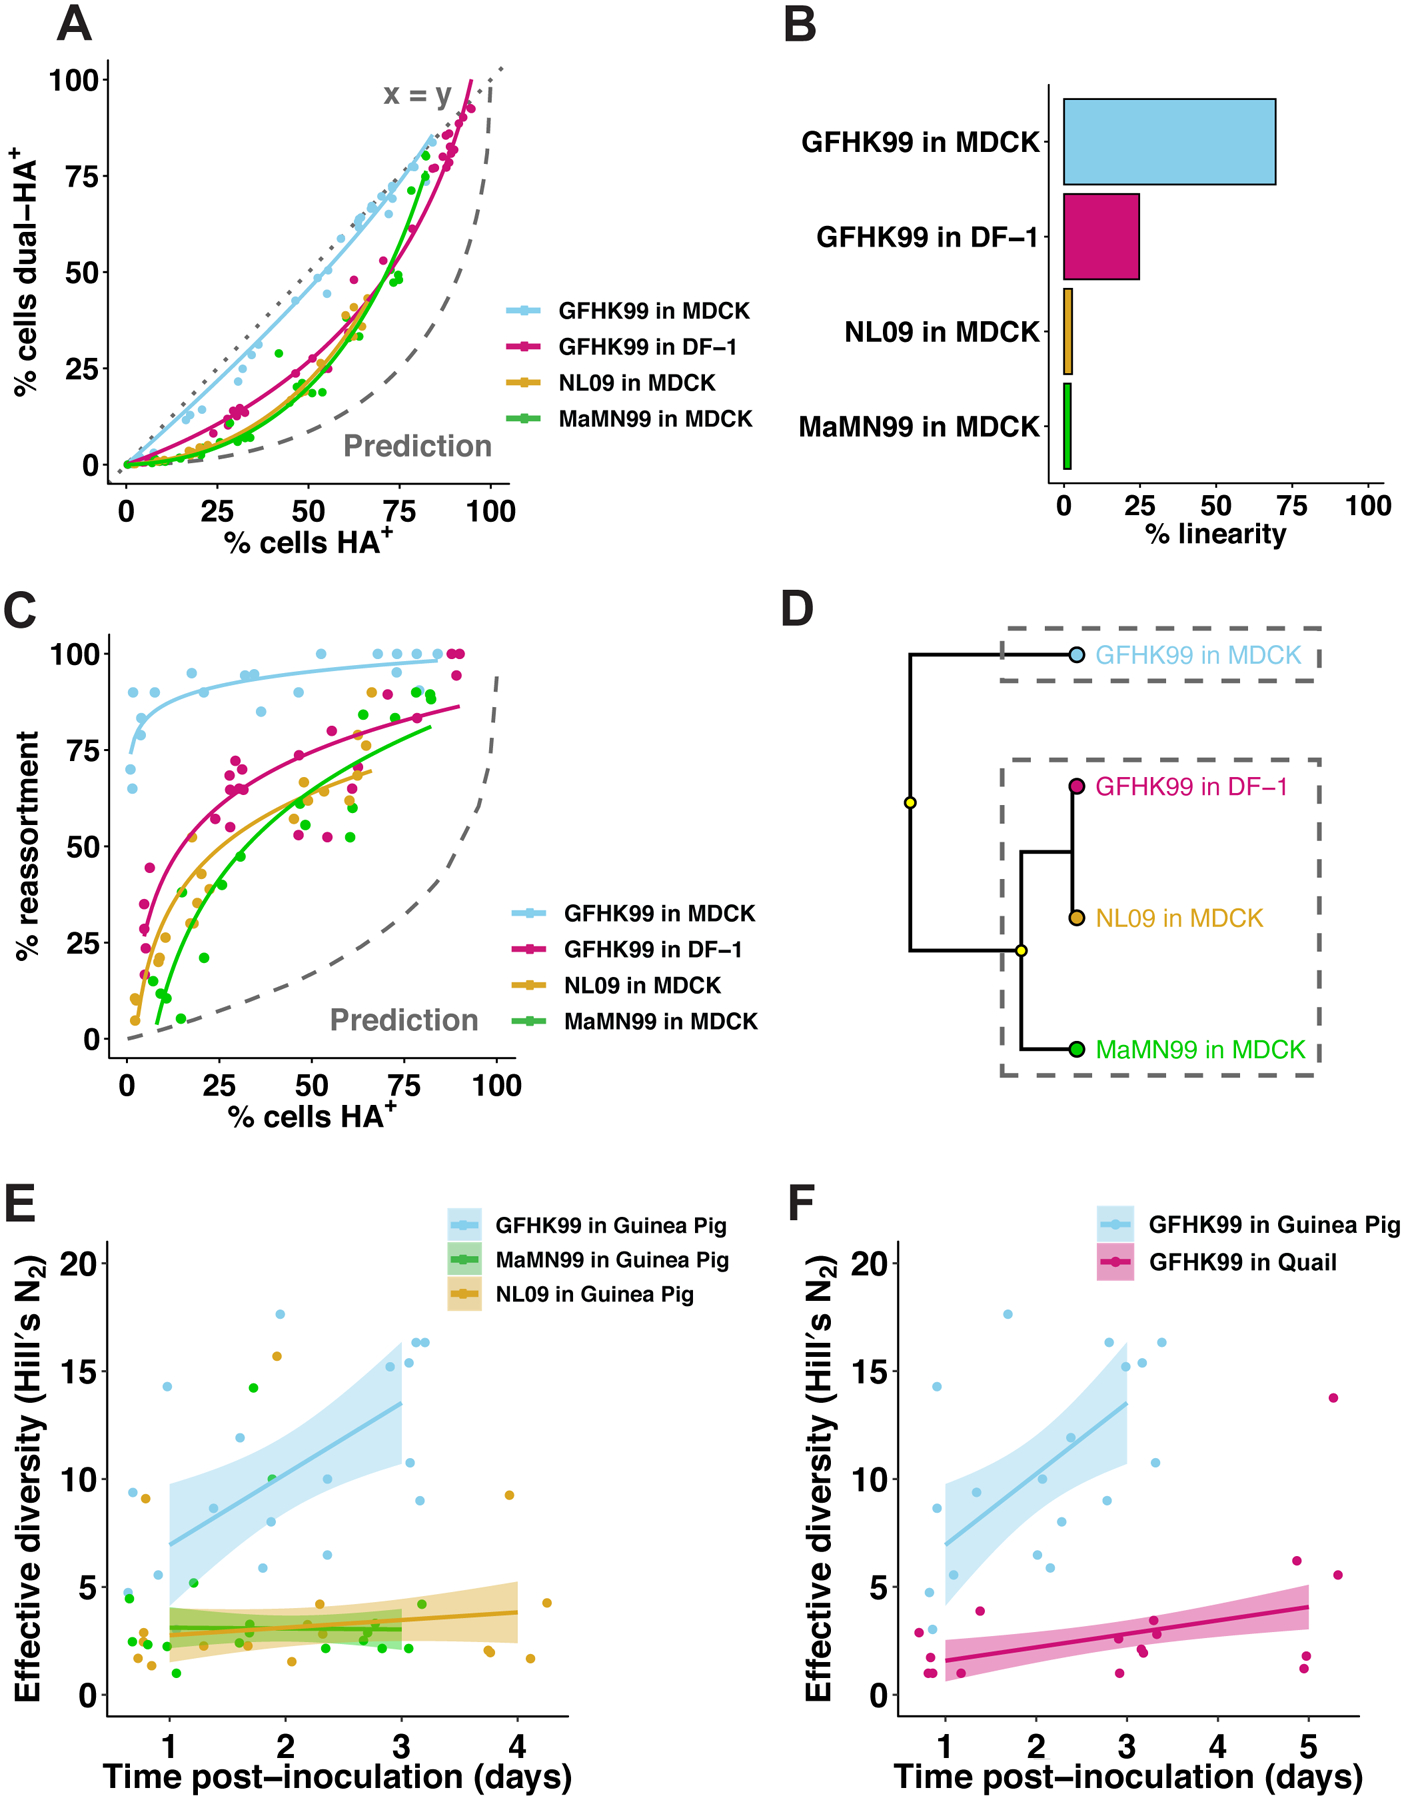
Figure 1. Coinfection and reassortment frequencies indicate that IAV multiplicity dependence varies with virus strain and host species.

A–D) MDCK or DF-1 cells were coinfected with homologous WT and VAR viruses of either GFHK99, MaMN99, or NL09 strain backgrounds at MOIs ranging from 10 to 0.01 PFU/cell. The relationship between % cells HA+ and % cells dual-HA+ (A) varies with strain and cell type, resulting in curves of differing % linearity (B). GFHK99, MaMN99, and NL09 viruses exhibit different reassortment levels in MDCK cells, but all show high reassortment relative to a theoretical prediction in which singly infected and multiply infected cells have equivalent burst sizes (C). GFHK99 virus reassortment levels differ in MDCK and DF-1 cells, but again reassortment in DF-1 cells remains high relative to the theoretical prediction in which multiple infection confers no advantage (C). Clustering analysis of reassortment and HA co-expression regression models determines that GFHK99 virus exhibits unique behavior in MDCK cells compared to DF-1 cells or other viruses in MDCK cells (D). Yellow circles indicate nodes with >95% bootstrap support. Panels (E) and (F) show results of WT/VAR coinfections performed in vivo. Because multicycle replication in vivo allows the propagation of reassortants, analysis of genotypic diversity rather than percent reassortment is more informative for these experiments. Thus, the effective diversity was calculated for each dataset and plotted as a function of time post-inoculation. In guinea pigs (n=6), GFHK99 WT and VAR1 viruses exhibit higher reassortment than MaMN99 or NL09 WT and VAR viruses, as indicated by increased genotypic diversity (E). The GFHK99 WT and VAR1 viruses exhibit higher reassortment in guinea pigs than in quail (n=5) (F). Guinea pig data shown in panels E and F are the same. NL09 virus reassortment data shown in (C) were reported previously57. Lines and shading represent prediction mean and 95% prediction interval (mean ± 1.96 * standard error) of robust linear regression.
