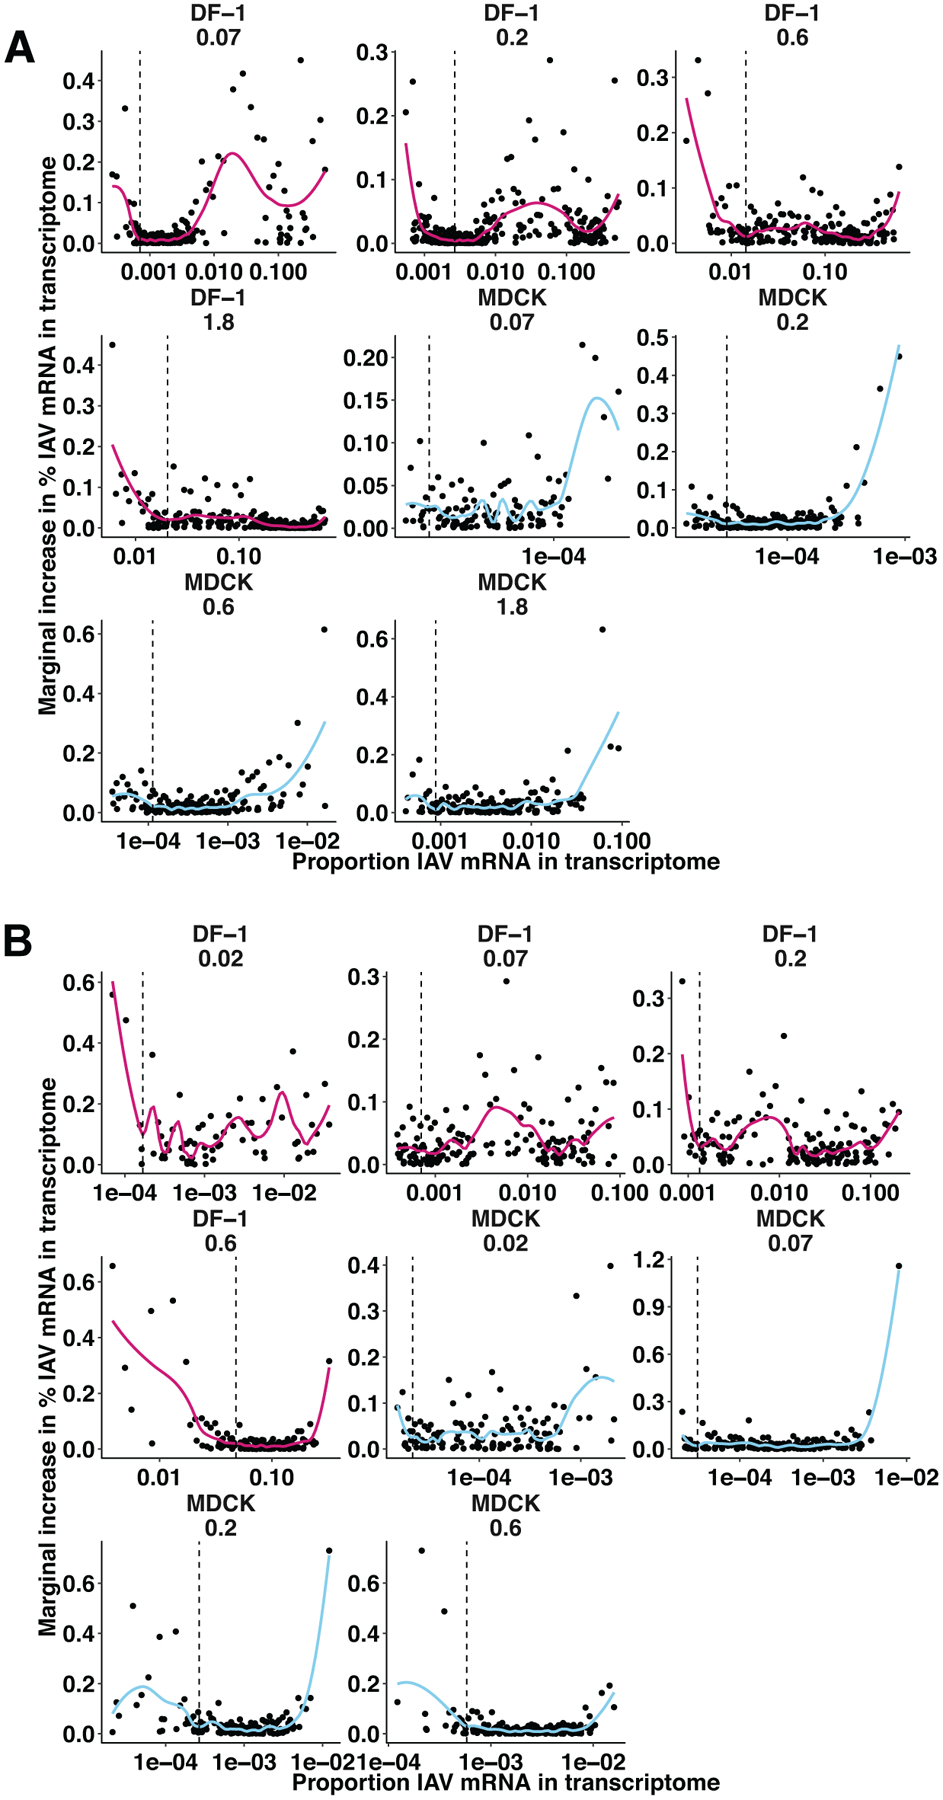
Extended Data Fig. 5. Preliminary analysis of single-cell mRNA sequencing data to exclude cells with viral mRNA that are likely uninfected.

A) Within each infection, cells in which viral RNA was detected were rank ordered by the proportion of their transcriptome that comprised viral RNA (% viral RNA), and the relative gain in % viral RNA from one cell to the next was plotted against the proportion of viral RNA in each cell. Local regression was performed separately for each infection, and the first local minimum of the resulting functions (indicated by dashed lines) indicated the point at which the marginal gain in % viral RNA was more consistent and less sensitive to the % viral RNA of the prior cell. Cells with % viral RNA values below this threshold were deemed falsely positive and considered uninfected for the analyses shown in Figure 5 and Extended Data Figure 6. Facets indicate individual infections, with lines colored by cell type (DF-1 = pink, MDCK = blue). B) The same analysis in panel A) was applied to the data from the second experiment, in which cells were co-inoculated with a 1:1 mixture of WT and mVAR1 viruses, as well as mVAR2 virus at an MOI of 0.1 PFU per cell in DF-1 cells, or 1.0 PFU per cell in MDCK cells. Only cells containing all eight mVAR2 segments were analyzed in this manner.
