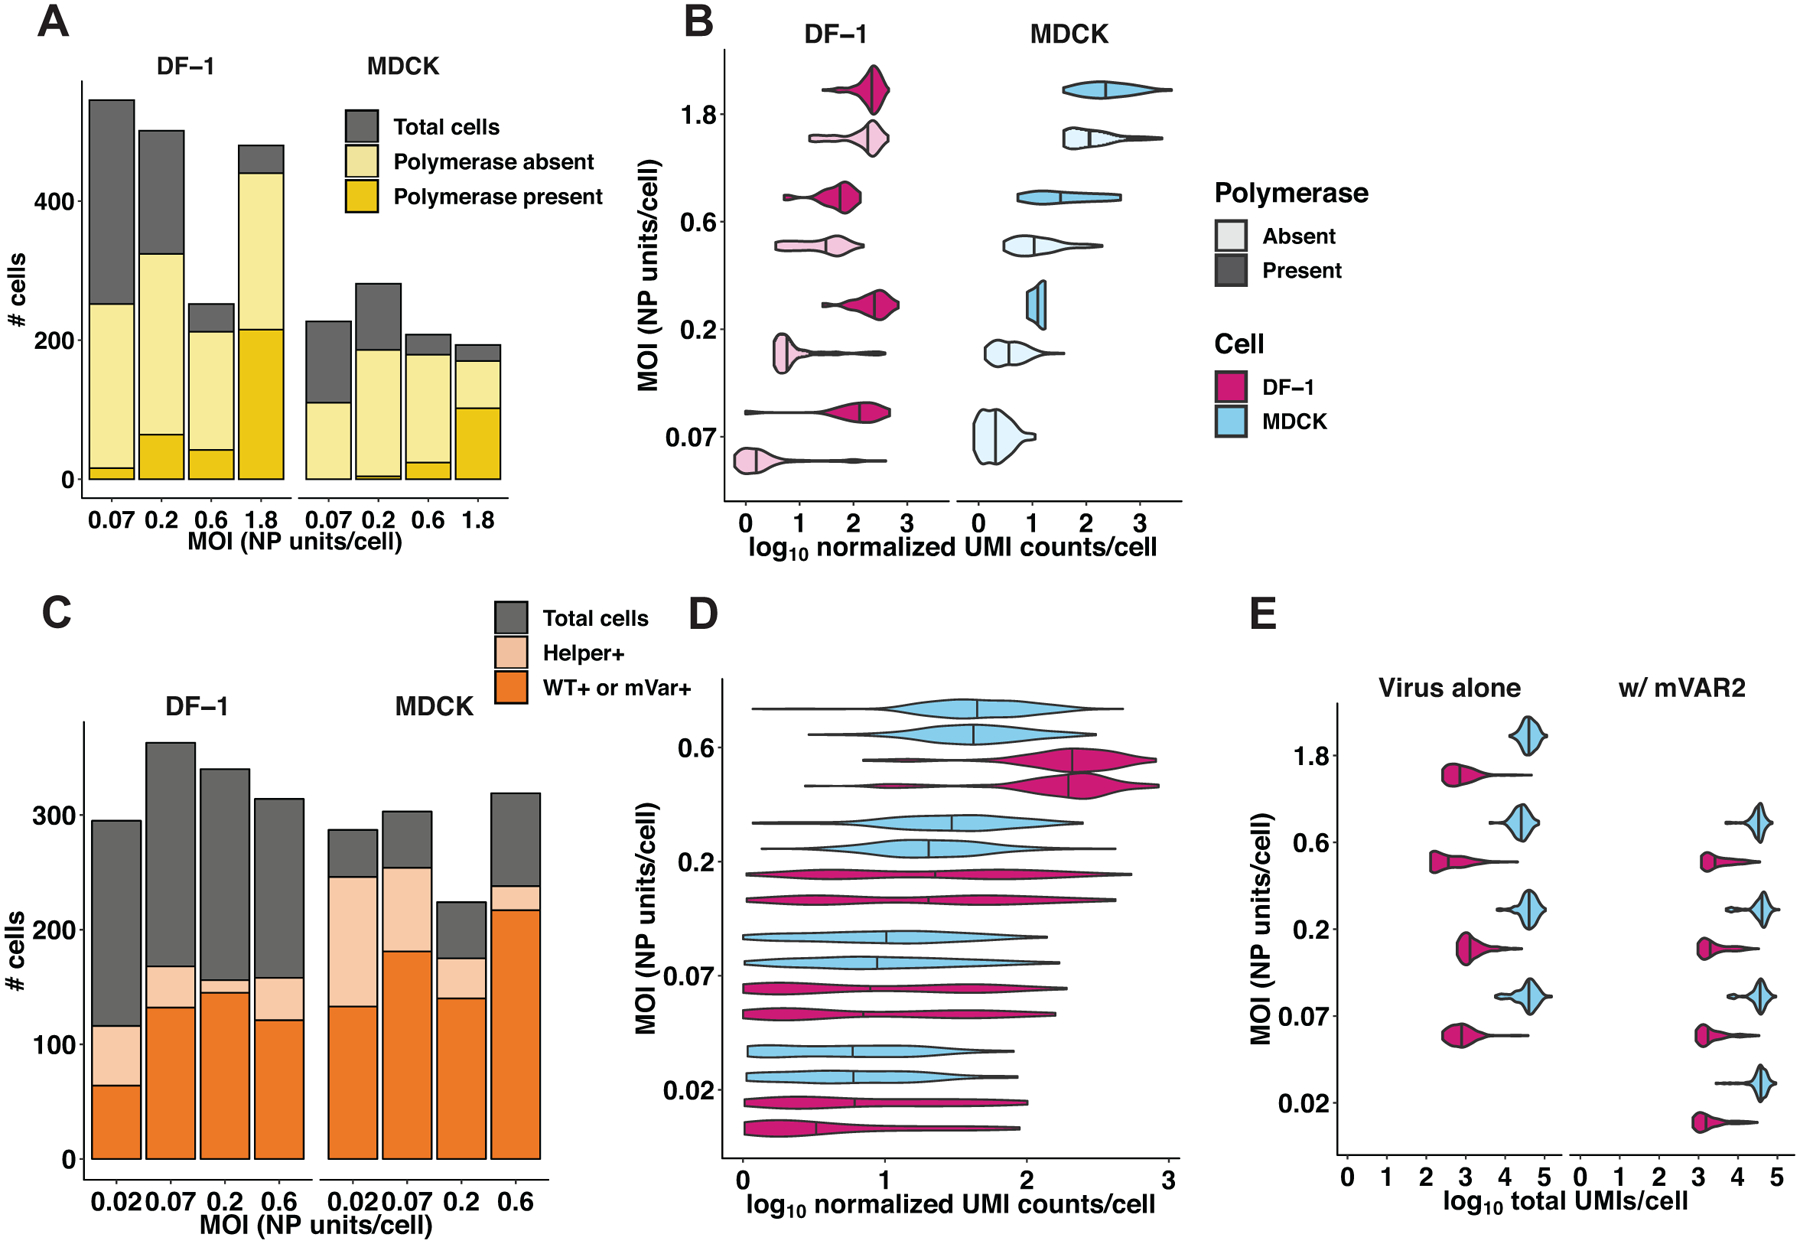
Extended Data Fig. 6. Validation of single-cell mRNA sequencing data.

(A, B, E) In the first single-cell sequencing experiment, DF-1 or MDCK cells were infected with GFHK99 WT virus at four different MOIs (0.07, 0.2, 0.6, 1.8 NP units per cell), and the transcriptomes of individual cells were sequenced using the 10x Genomics Chromium platform (n = 1,228 DF-1 cells, 645 MDCK cells, 1 sequencing replicate per infection condition). A) The total number of cells sequenced, infected, and containing PB2, PB1, PA, and NP segments are represented by the cumulative heights of the gray, light yellow, and dark yellow bars, respectively. Cells that were excluded by the analysis shown in Extended Data Figure 5 are contained within the gray bar. B) Each violin plot shows the full distribution of log10-transformed viral mRNA abundance, for all eight viral transcripts combined, in individual infected cells. Vertical lines represent the median of each distribution. The data are stratified by cell type (MDCK cells in blue, DF-1 cells in pink), MOI, and the presence of polymerase complex (light shading = cells missing PB2, PB1, PA, or NP; dark shading = cells in which PB2, PB1, PA and NP are all detected). The absence of a dark shaded distribution for MDCK cells at the lowest MOI is due to the absence of any cells in which all four of these segments were detected. (C, D, E) In the second single-cell sequencing experiment, DF-1 or MDCK cells were infected with GFHK99 WT and mVAR1 viruses at total MOIs of 0.07, 0.2, 0.6, 1.8 NP units per cell, and simultaneously with a constant dose of mVAR2 virus (n = 462 DF-1 cells, 671 MDCK cells, 1 sequencing replicate per infection condition). C) The total number of cells sequenced, containing all eight mVAR2 genome segments, and infected with either WT or mVAR1 virus are represented by the cumulative heights of the gray, light orange, and dark orange bars, respectively. As in panel (A), cells that were deemed falsely positive are contained within the gray bar. D) Distributions of viral UMIs per cell are shown separately for WT (bottom of each cell-MOI pair) and mVAR1 (top of each cell-MOI pair). Vertical lines represent the median of each distribution. As expected, no significant difference was detected between WT and mVAR1 transcript levels (p = 0.061, linear mixed effects model). E) The distributions of total UMIs detected per cell are shown for each cell type, MOI, and infection type, from both experiments. Vertical lines represent the median of each distribution.
