
Figure 5. Homologous coinfecting virus boosts GFHK99 viral transcription in single cells and reveals comparable rates of segment detection in MDCK and DF-1 cells.
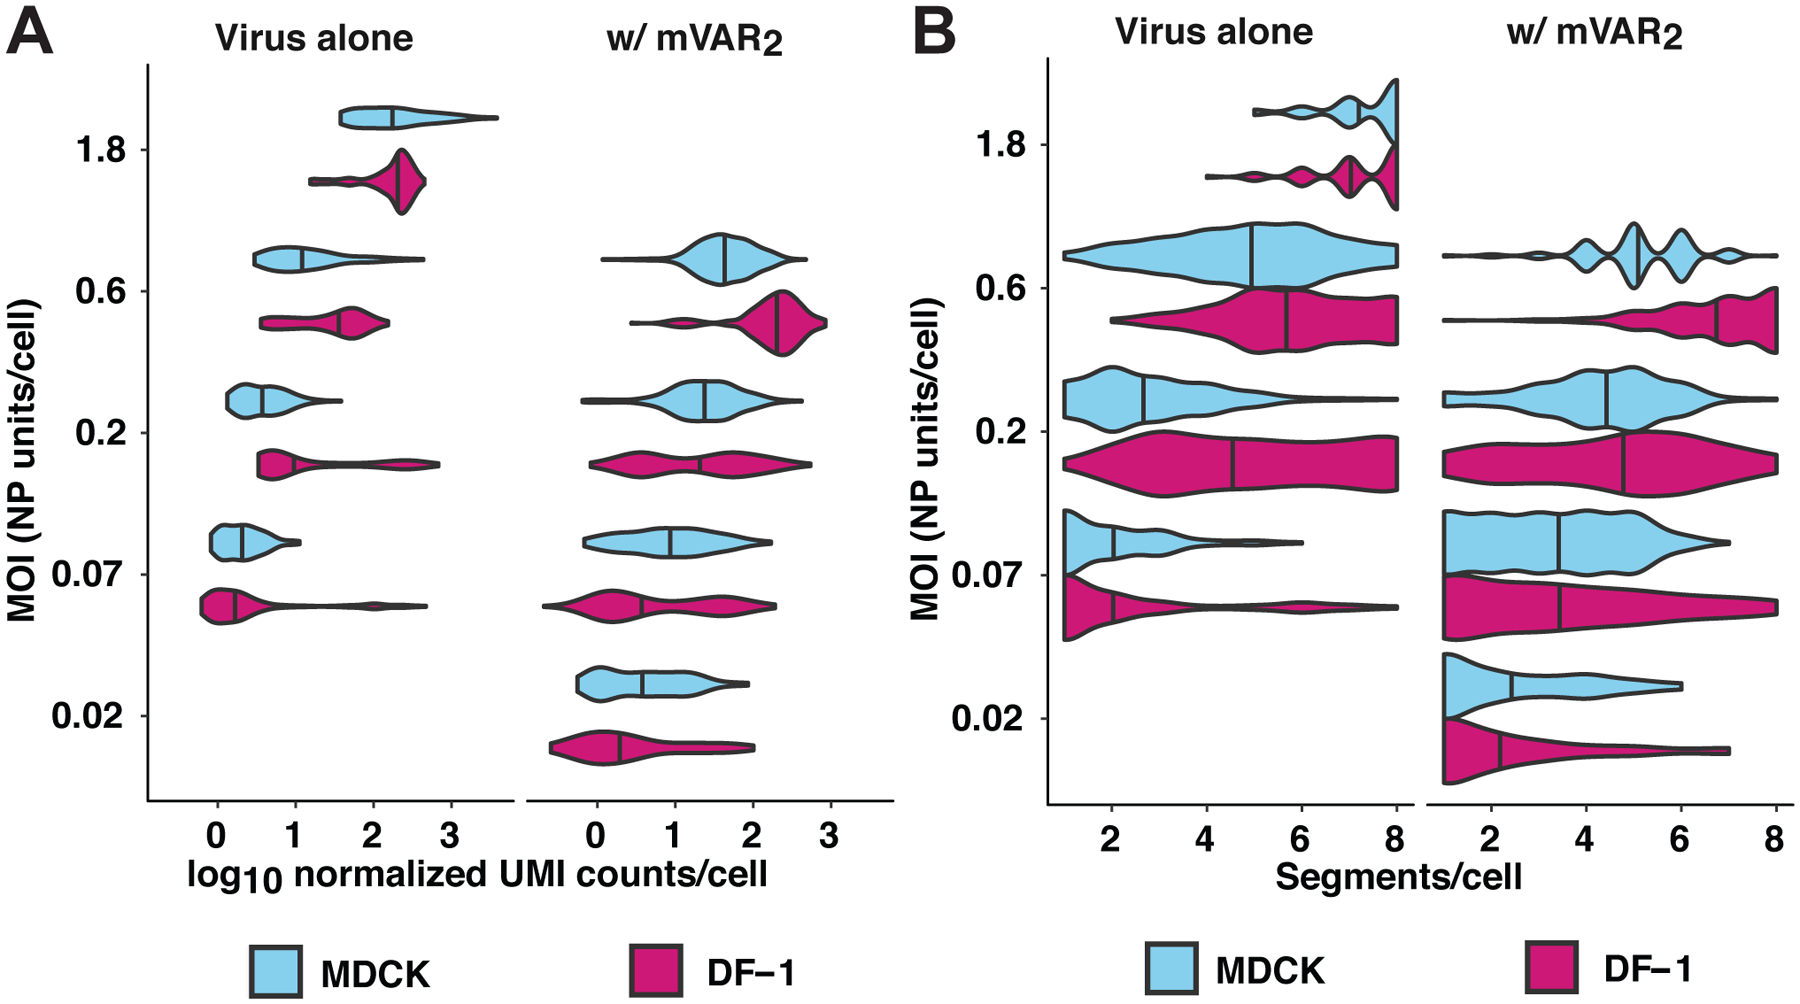
DF-1 or MDCK cells were infected with GFHK99 virus (left facet) at MOIs of 0.07, 0.2, 0.6, or 1.8 NP-expressing units per cell (n = 1,228 DF-1 cells, 645 MDCK cells), or a 1:1 mixture of GFHK99 WT and GFHK99 mVAR1 viruses at four different total MOIs (0.02, 0.07, 0.2, 0.6 NP-expressing units per cell, n = 462 DF-1 cells, 671 MDCK cells) and a constant amount of GFHK99 mVAR2 virus (0.1 PFU per cell in DF-1 cells, 1.0 PFU per cell in MDCK cells) (right facet). Per condition, two replicate wells were infected and cells from these replicates were pooled prior to analysis, giving n=1 sequencing replicate per infection condition. The number of cells analyzed per condition is shown in Extended Data Figure 6. Each violin plot shows the full distribution of total viral RNA (A) or distinct viral genome segments (B) per cell in each cell-MOI infection condition. Vertical lines denote the median of each distribution. UMI = unique molecular identifier.