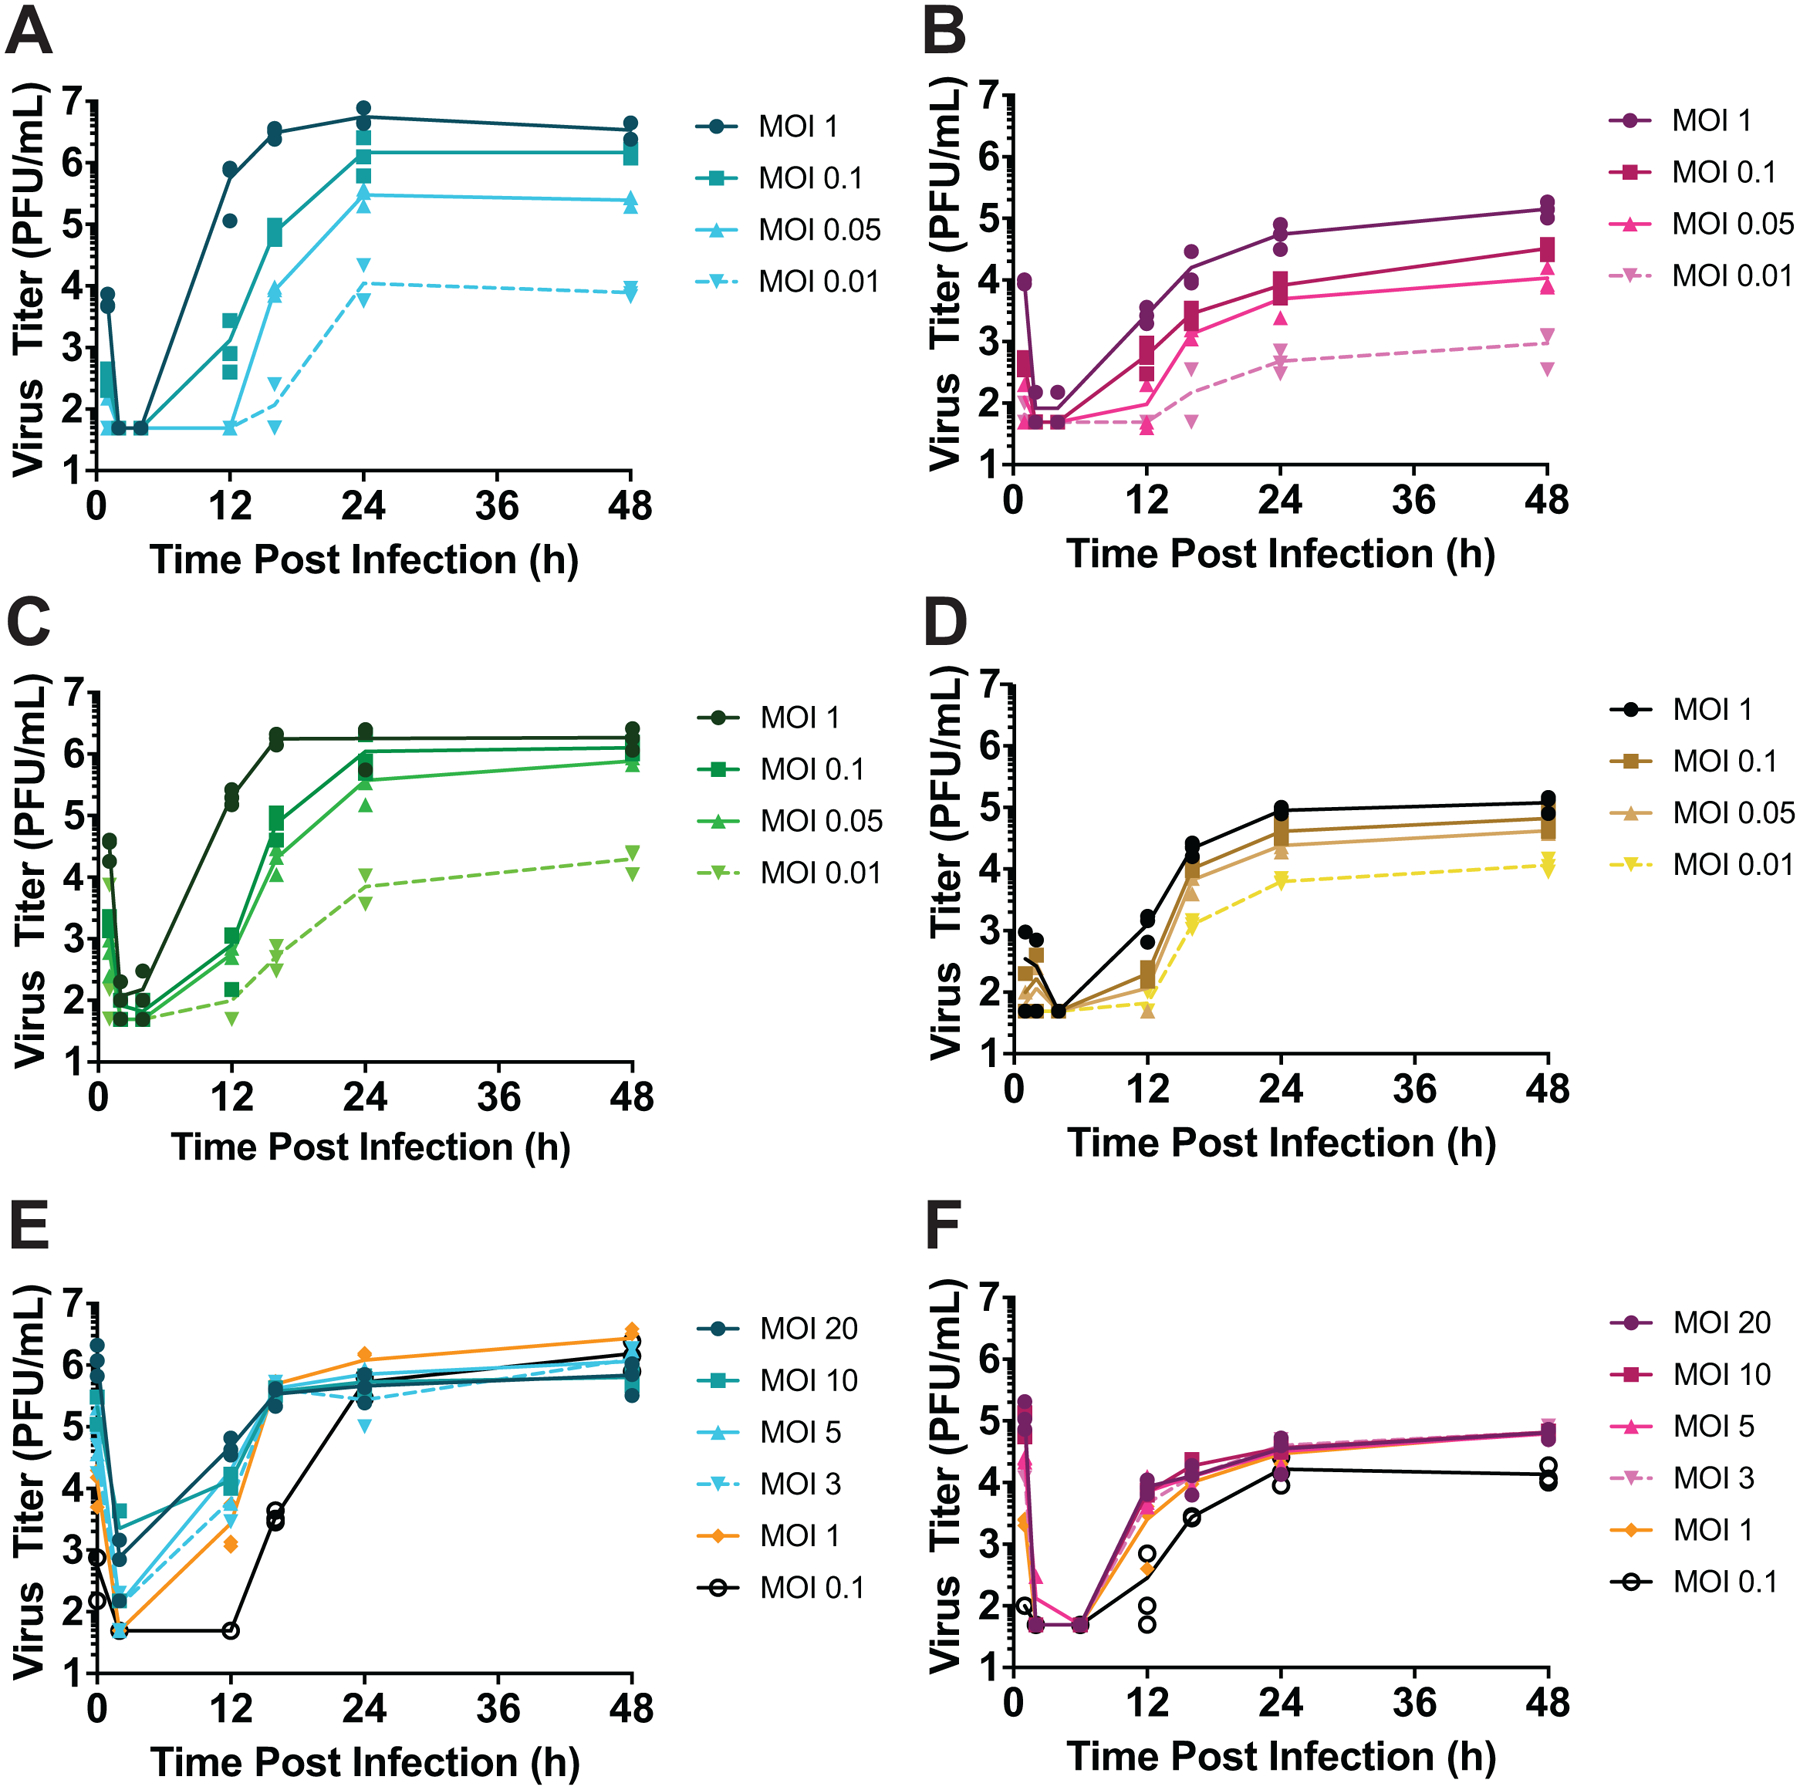
Extended Data Fig. 2. Increasing MOI increases viral productivity at sub-saturating, but not saturating MOIs.

Data relate to Figure 2. MDCK or DF-1 cells were infected under single-cycle conditions at a range of MOIs. Low MOI range is shown in panels (A) to (D) and high MOI range is shown in panels (E) and (F). As shown in Extended Data Figure 1, MOIs < 1 PFU/cell were found to be sub-saturating. Viral titers observed at the indicated MOIs are plotted against time post-infection for GFHK99 virus in MDCK cells (A), GFHK99 virus in DF-1 cells (B), MaMN99 virus in MDCK cells (C), NL09 virus in MDCK cells (D), GFHK99 virus in MDCK cells (E), and GFHK99 virus in DF-1 cells (F). Lines connect the mean values for technical replicates sampled at each time point.
