
Figure 2. TREX1 promotes chromothripsis.
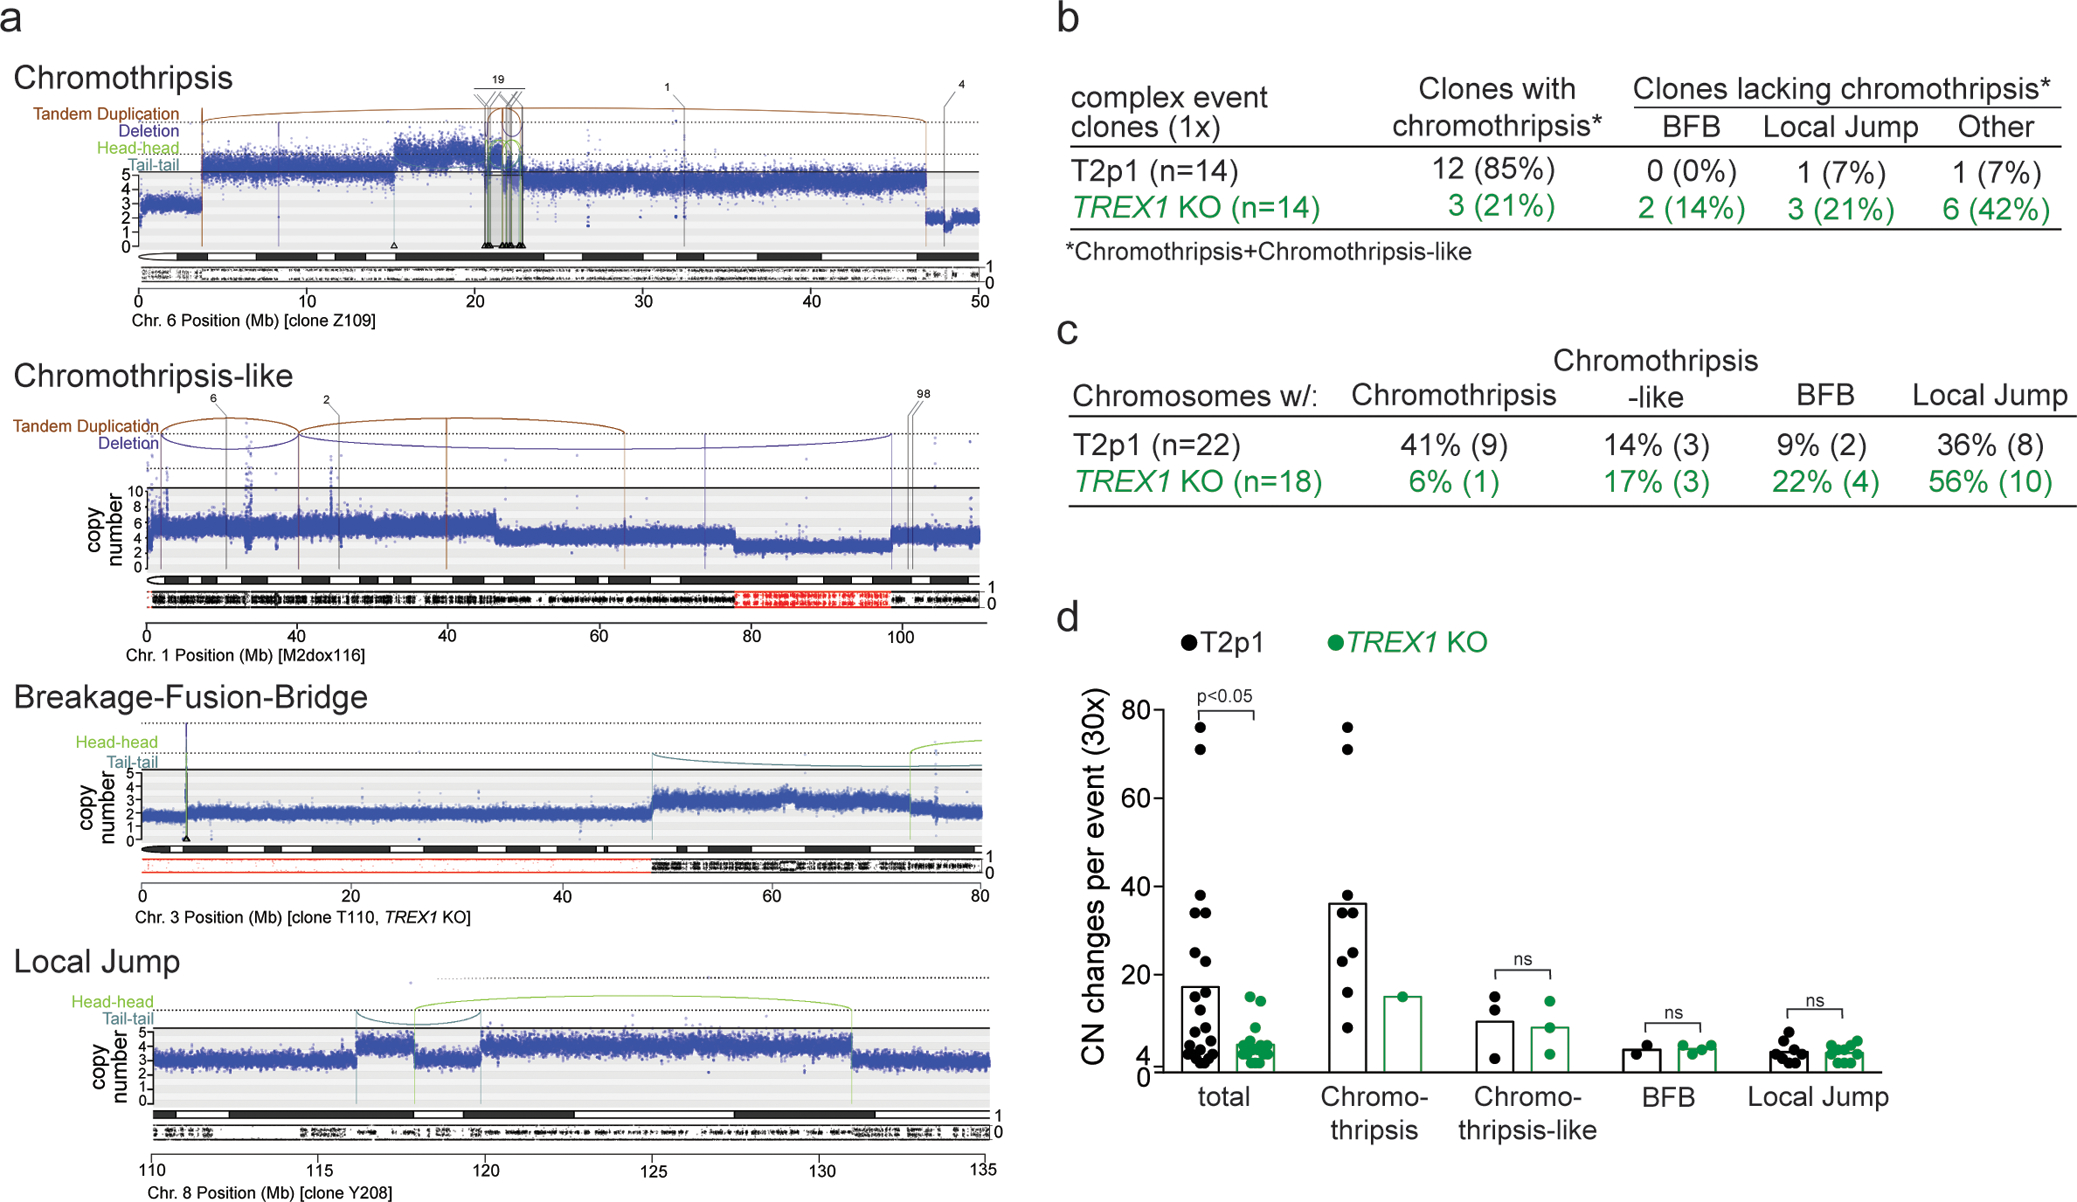
a, Examples of chromothripsis (see also Fig. 1a and Fig. 3h,I below), chromothripsis-like, Breakage-Fusion-Bridge, and Local Jump patterns in post-crisis clones derived from T2p1 and TREX1 KO cells. DNA CN profiles and rearrangement joins were obtained from 30x target coverage WGS. Annotation as in Fig. 1a. Variant allele frequency tracks are shown below the chromosome ideograms. b, Summary of number of clones that displayed the types of rearrangements shown in (a) as determined by 30x WGS of 14 T2p1 and TREX1 KO post-crisis clones with complex events observed in 1x WGS. c, Summary of the number of chromosomes in post-crisis T2p1 and TREX1 KO clones examined in (b) that display the indicated rearrangements. d, Plot of the number of CN changes associated with the complex events indicated in post-crisis T2p1 and TREX1 KO clones described in (b). P values derived from ANOVA (ns: not significant). Statistical testing of copy number differences in chromothripsis events between T2p1 and TREX1 KOs was not possible because the data set only includes one chromothripsis event in the TREX1 KOs.