Figure 2:
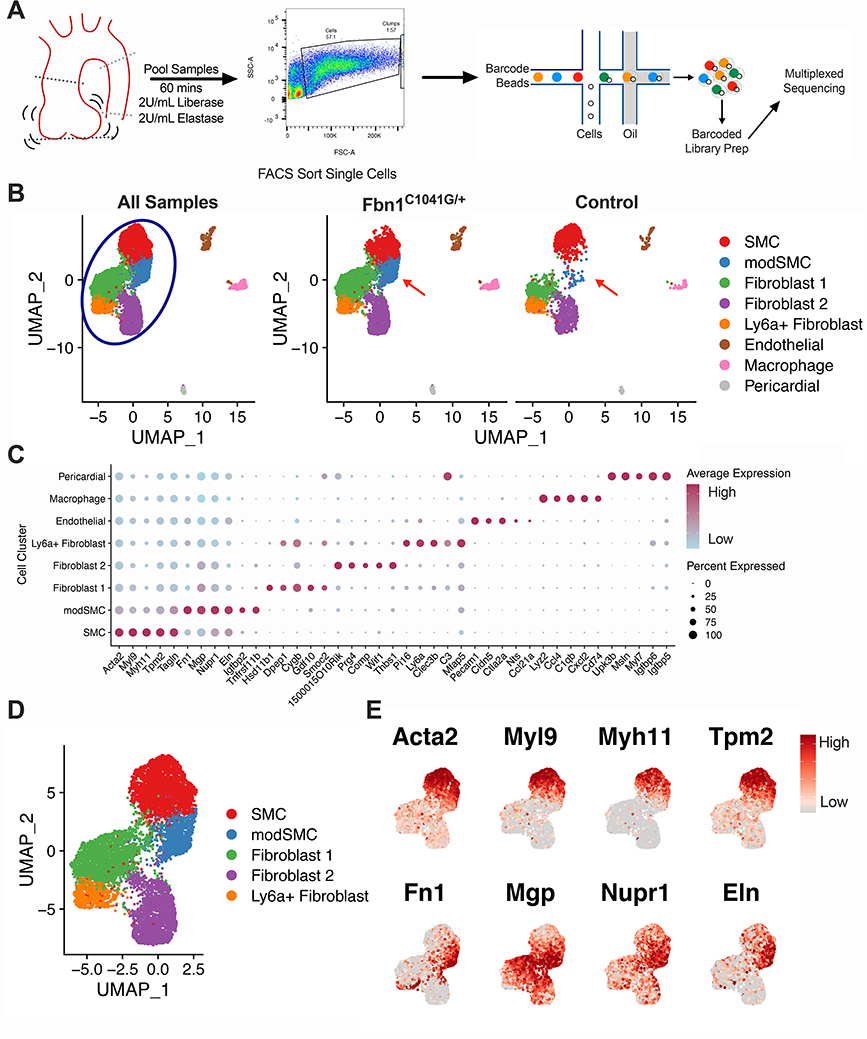
Single cell RNA sequencing (scRNAseq) of Fbn1C1041G/+ and control mouse aortic Root/AS tissue reveals disease-associated cluster. A Experiment workflow for scRNAseq. Aortic root and proximal ascending aorta tissue are digested in enzyme mixture to suspend cells. FACS eliminates debris, cell clumps, and dead cells prior to single cell capture and sequencing. B Uniform Manifold Approximation and Projection (UMAP) dimensional reduction of >9,800 aortic cells from Fbn1C1041G/+ (n=4) and control (n=3) mice. Blue circle denotes major clusters selected for further analysis, red arrows indicate modulated SMC (modSMC) cluster enriched in Fbn1C1041G/+. C Dotplot for highest specificity gene markers of cell clusters. Dot size represents percent of cells expressing denoted gene, color represents average normalized expression level within the denoted cluster. D UMAP projection of modSMC cluster positioned between SMC and fibroblast clusters. E Feature plots demonstrate reduced expression of contractile genes (Acta2, Myl9, Myh11, Tpm2) and enriched expression of fibronectin 1 (Fn1), matrix gla protein (Mgp), nuclear protein 1 (Nupr1) and elastin (Eln) in modSMCs. Color scale indicates range from 5th (Low) to 95th (High) percentile of normalized expression levels by individual cells.

