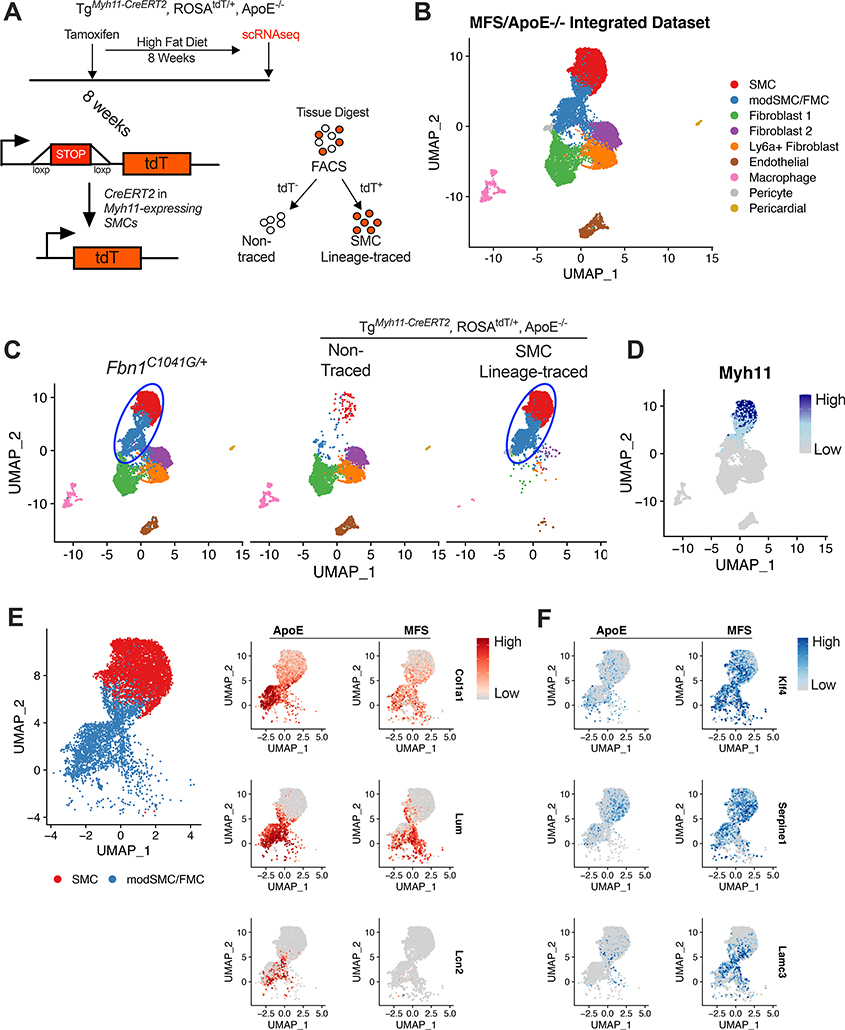
Figure 3:
Fbn1C1041G/+ modSMCs co-cluster with analogous cell type in SMC lineage-traced atherosclerosis model. A Cartoon depiction of SMC lineage-tracing in TgMyh11-CreERT2, ROSAtdT/+, ApoE−/− mouse model. Tamoxifen at 8 weeks induces Cre recombinase-mediated activation of the tandem dimeric Tomato (tdT) in cells expressing Myh11 leading to permanent fluorescence in SMCs. High fat diet induces atherosclerosis prior to scRNAseq. B Integrated scRNAseq datasets from TgMyh11-CreERT2, ROSAtdT/+, ApoE−/− and Fbn1C1041G/+ mice with all cell clusters. C UMAP projection of scRNAseq data split by input sample. Blue oval indicates common SMC sub-clusters in each model. 99% of cells assigned modSMC identity in Fbn1C1041G/+ dataset co-clustered with SMC lineage-traced clusters from the ApoE−/− dataset. D Myh11 expression in integrated dataset. E UMAP projection of SMC/modSMC clusters from both models and feature plots depicting expression of Col1a1, Lum, and Lcn2 (enriched in ApoE−/−) split by model. F Analogous plots for example genes enriched in Fbn1C1041G/+ (‘MFS’) mice (Klf4, Serpine1, Lamc3). Color scale indicates range from 5th (Low) to 95th (High) percentile of normalized expression levels by individual cells.

