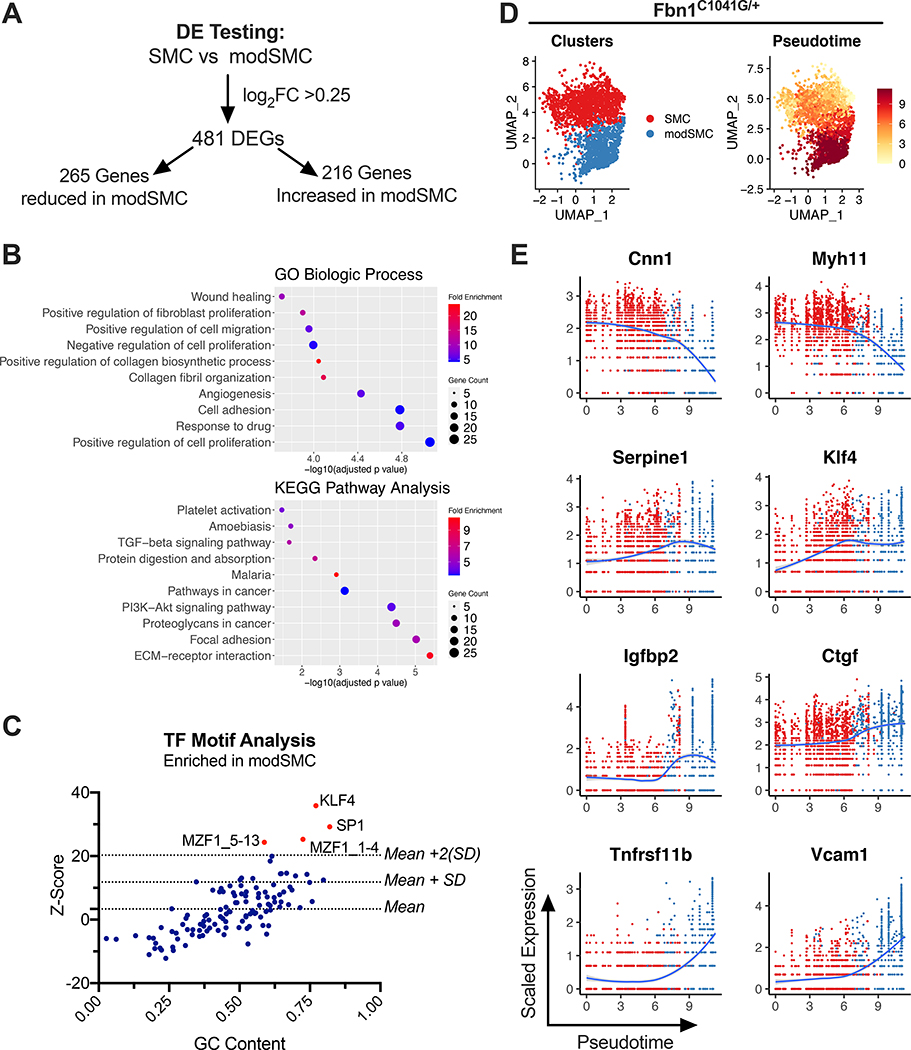
Figure 4:
Dynamic phenotype modulation across SMC spectrum in Fbn1C1041G/+ mice. A Results of dichotomous differential expression test comparing modSMC to SMC clusters from Fbn1C1041G/+ and control mouse merged dataset. B Top 10 significant gene ontology (GO) terms and KEGG pathway terms overrepresented by genes with enhanced expression in modSMCs (n=216 genes). C Transcription factor (TF) motif analysis for genes upregulated in modSMC cluster (n=216 genes). TFs with Z score >2 standard deviations above mean considered significant. D UMAP projections of Fbn1C1041G/+ SMC/modSMC clusters and pseudotime trajectory analysis scores demonstrate dynamic modulation across spectrum. E Scatter plots for example DEGs depicting expression level as a function of pseudotime score. Each point represents a single cell, color scheme depicts Seurat clustering (red=SMC, blue=modSMC).

