Figure 5:
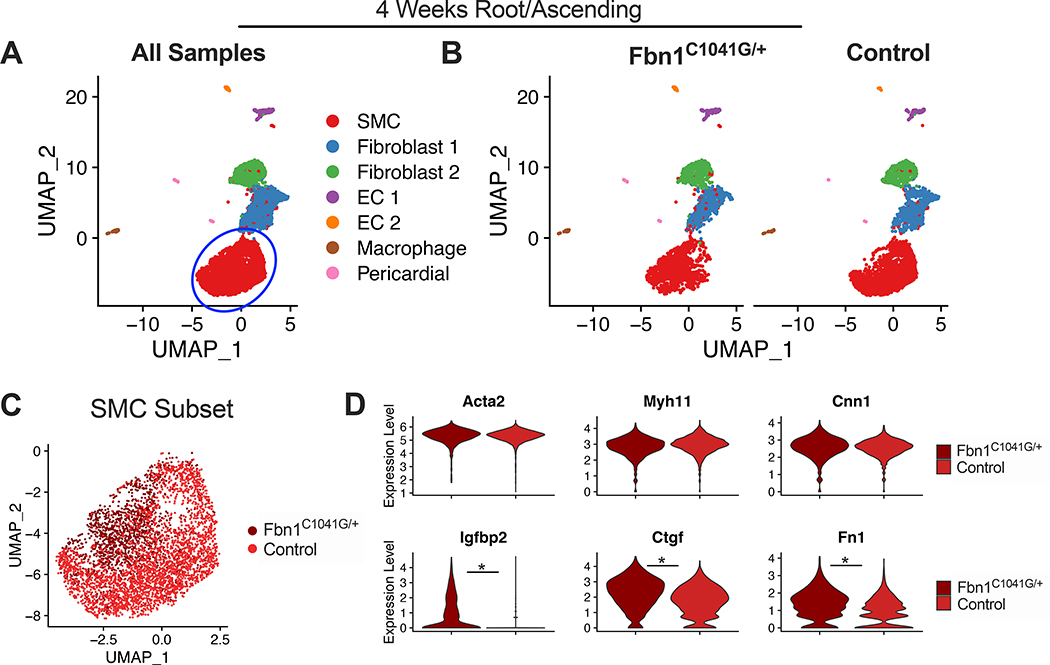
scRNAseq from 4-week Fbn1C1041G/+ and control Root/AS tissue. A UMAP dimensional reduction of merged data (>7,200 cells) with clustering of major aortic cell types. Blue circle indicates subsampled SMC cluster. B UMAP plot split by genotype with similar clustering projection and no disease-specific clusters. C UMAP projection of SMC subset color-coded by genotype. D Consistent expression of contractile genes Acta2, Myh11, and Cnn1 across genotypes. Violin plots for markers of Fbn1C1041G/+ SMCs (Igfbp2, Ctgf and Fn1). * denotes adjusted p-value <0.01.

