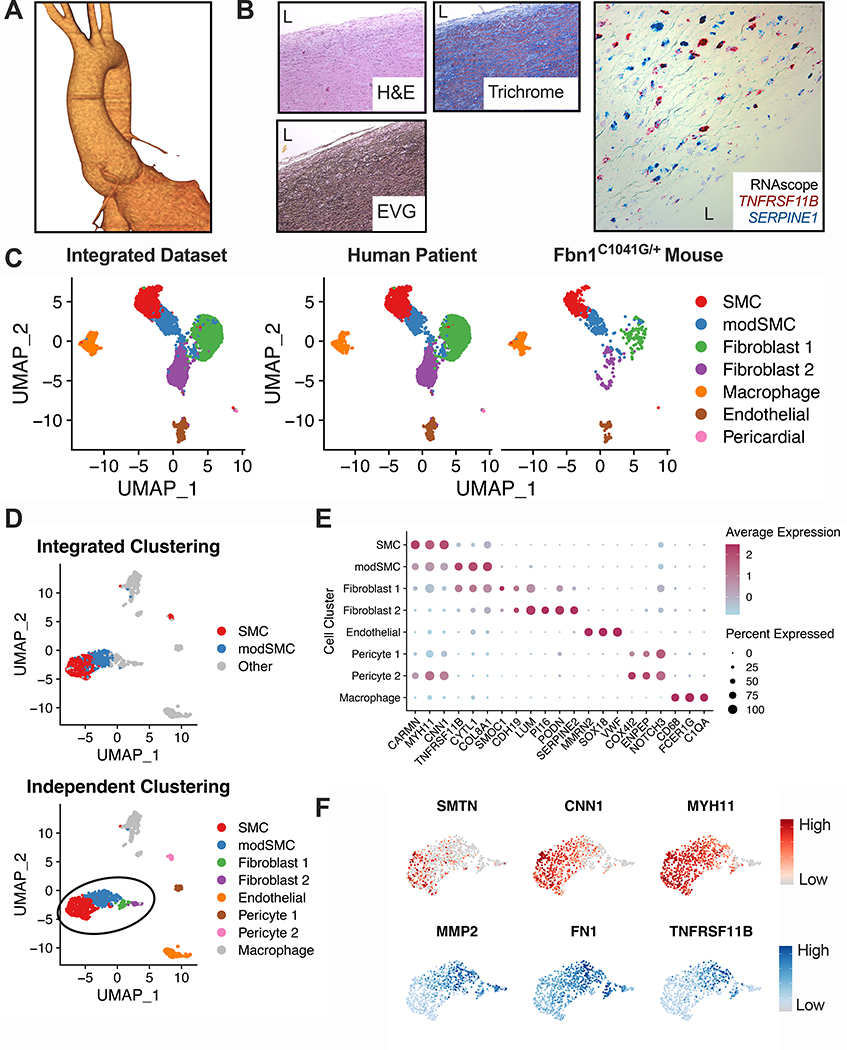
Figure 7:
Human MFS aortic root aneurysm scRNAseq. A Three-dimensional CTA reconstruction of 4.8cm aortic root aneurysm. B Representative histologic stains and RNAscope in-situ hybridization (20× magnification) for SERPINE1 (blue) and TNFRSF11B (red) from human MFS aortic tissue. ‘L’ indicates aortic lumen. C Results from dataset integration of human and Fbn1C1041G/+ mouse scRNAseq. modSMC cluster (blue) is present within both individual datasets. D Independent dimensional reduction and cell clustering of MFS human scRNAseq data. Similar clustering results are observed when plotted based on integrated dataset clustering (top) or independent clustering (human sample only, bottom). E DotPlot for top cluster markers in human dataset. Dot size denotes percentage of cells expressing noted gene, color scale denotes relative expression values. F Representative expression plots for (DEGs) in human modSMCs compared to SMCs. Reduced genes (top) in red, enriched genes (bottom) in blue. Color scale indicates range from 5th (Low) to 95th (High) percentile of normalized expression levels by individual cells.

