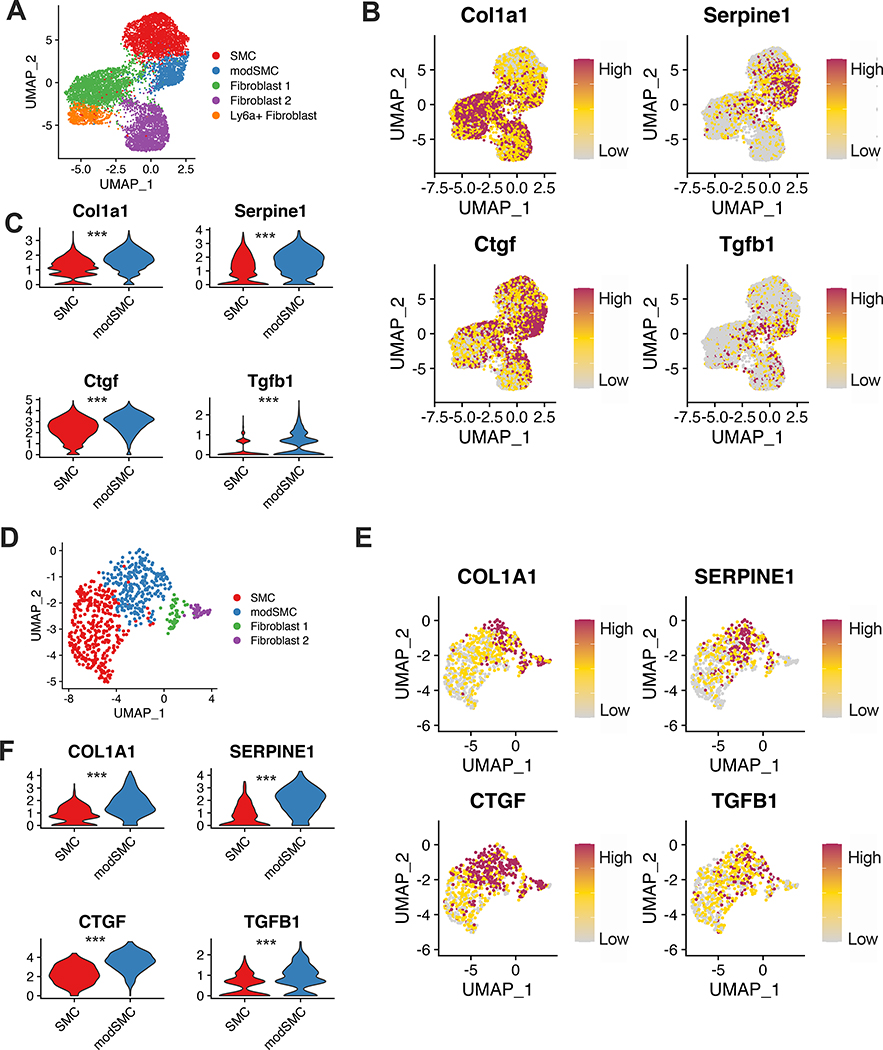
Figure 8:
Transcriptomic signature of TGF-β signaling is enhanced in modSMCs. A UMAP dimensional reduction plot of Fbn1C1041G/+ and control adult mice SMC, modSMC and fibroblast clusters. B expression plots and C violin plots demonstrating individual cell transcript levels for canonical TGF-β signaling-responsive genes collagen 1 (Col1a1), connective tissue growth factor (Ctgf), plasminogen activator inhibitor-1 (Serpine1) and TGF-β1 ligand (Tgfb1). D-F Analogous data from human MFS patient aortic root tissue. ***p<0.001 by Wilcoxon rank sum test. Color scale indicates range from 5th (Low) to 95th (High) percentile of normalized expression levels by individual cells.

