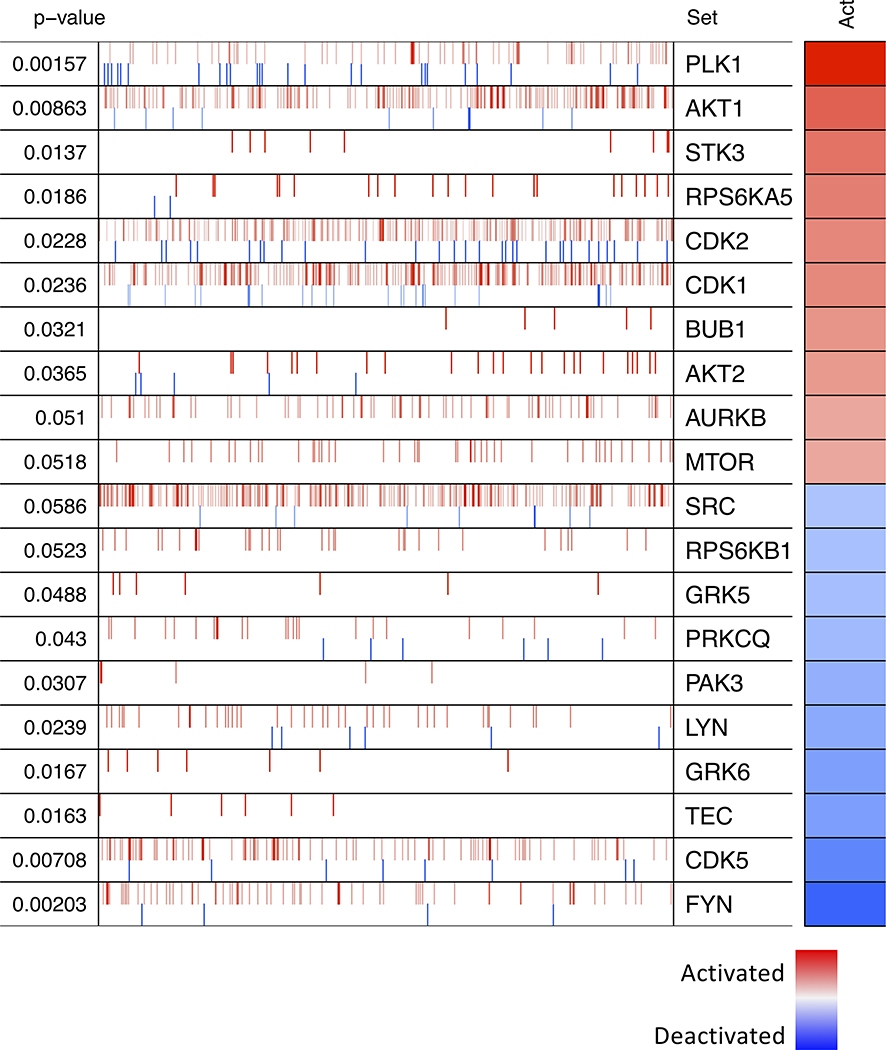
Figure 5. Kinase protein activities inferred using MARINa.
The top 10 kinases predicted to be most activated (red) or deactivated (blue) in the 17q22 loss group compared with all other samples are shown. The targets of each kinase are shown as tick marks with red vertical lines representing positive targets and blue vertical lines negative targets of a given kinase. Each row also illustrates the p-value and inferred differential activity (Act) for each kinase.

