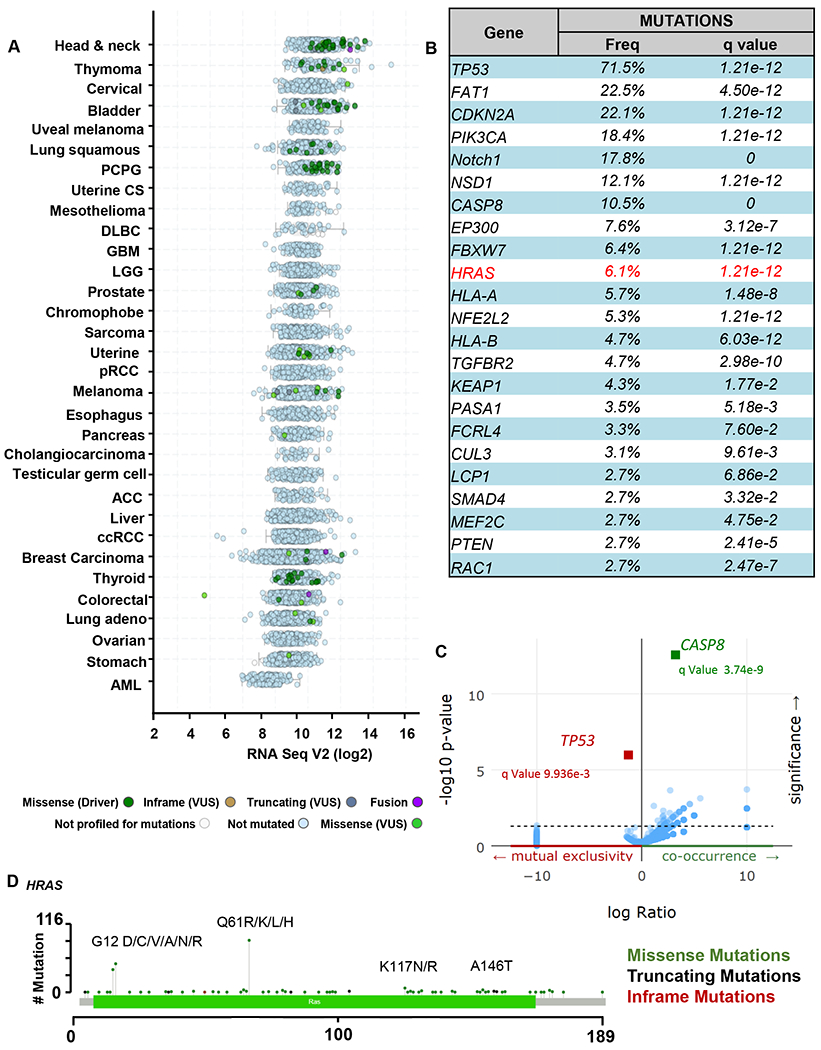
Figure 1. Genomics of HRAS-mutant HNSCC subset.

(A) Pan-cancer analysis of the TCGA database focused on HRAS gene expression and mutations. Expression level of HRAS indicated as Log2 TPM (Transcript Count Per Million) and mutation frequency of HRAS (green) across different cancer types in the Cancer Genome Atlas (TCGA) dataset are represented. (B) Percentage of samples with one or more mutations in the major driver-signaling pathways, including HRAS, in HNSCC (TCGA dataset, n=523). Percentage of samples with mutations is indicated, and the corresponding statistical significance (q value). (C) Co-occurrence and mutual exclusivity of HRAS mutations in HNSCC (TCGA dataset, n=523). (D) Mutational Plot representing the analysis of cancer-associated HRAS mutations from TCGA for HNSCC. The frequency of mutations is depicted by the height of the lollipop.
