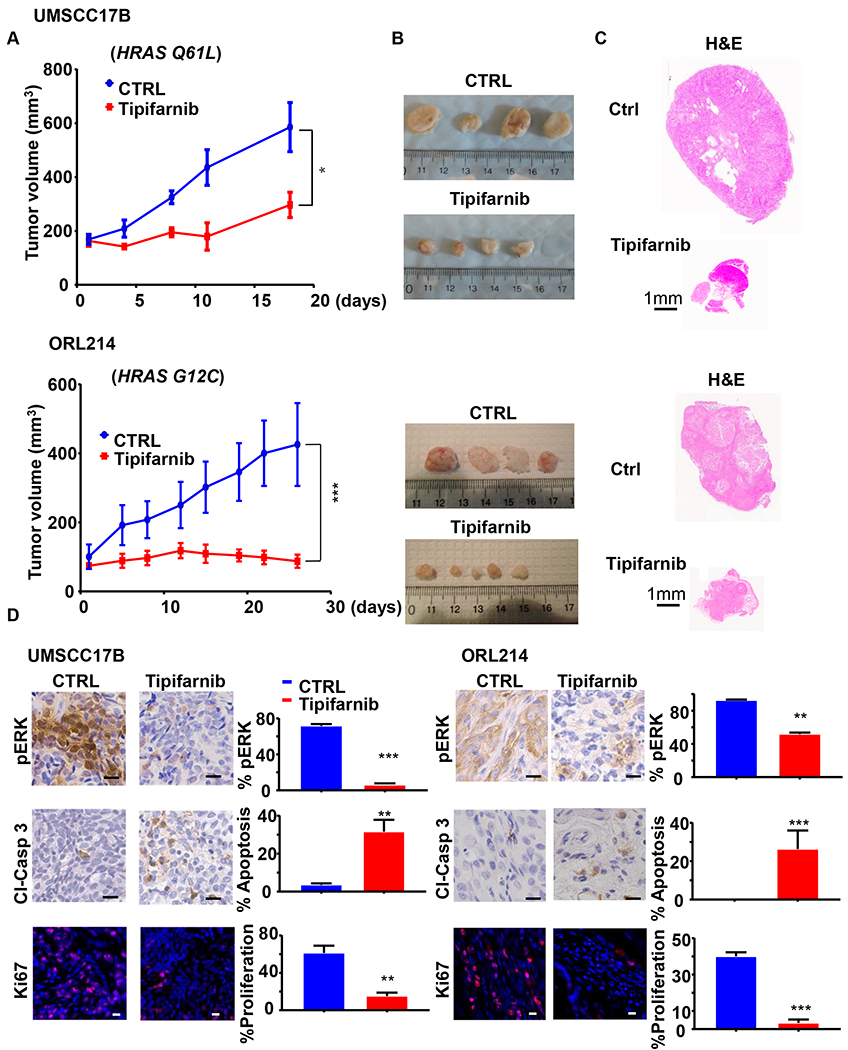
Figure 4. Antitumor activity of tipifarnib in cell line-derived HNSCC xenograft models.

(A) UMSCC17B (top) and ORL214 (bottom) were transplanted into athymic nude mice and NOD-SCID mice respectively and treated with vehicle or tipifarnib (60mg/kg BID) as indicated. (*P<0.05, ***P< .001 when compared with the control-treated group, n = 6 per group). (B) Representative tumor images and (C) histological sections from each treatment group in panel A. (D-E) Left, representative immune-histochemical analysis of pERK and cleaved-Caspase 3, and representative immunofluorescence analysis of Ki67 in tumors from panel A. On the right, quantification from images on the left using Qupath software. (*P<0.05, **P< .01, ***P< .001 when compared with the control-treated group, n = 3 per group).
