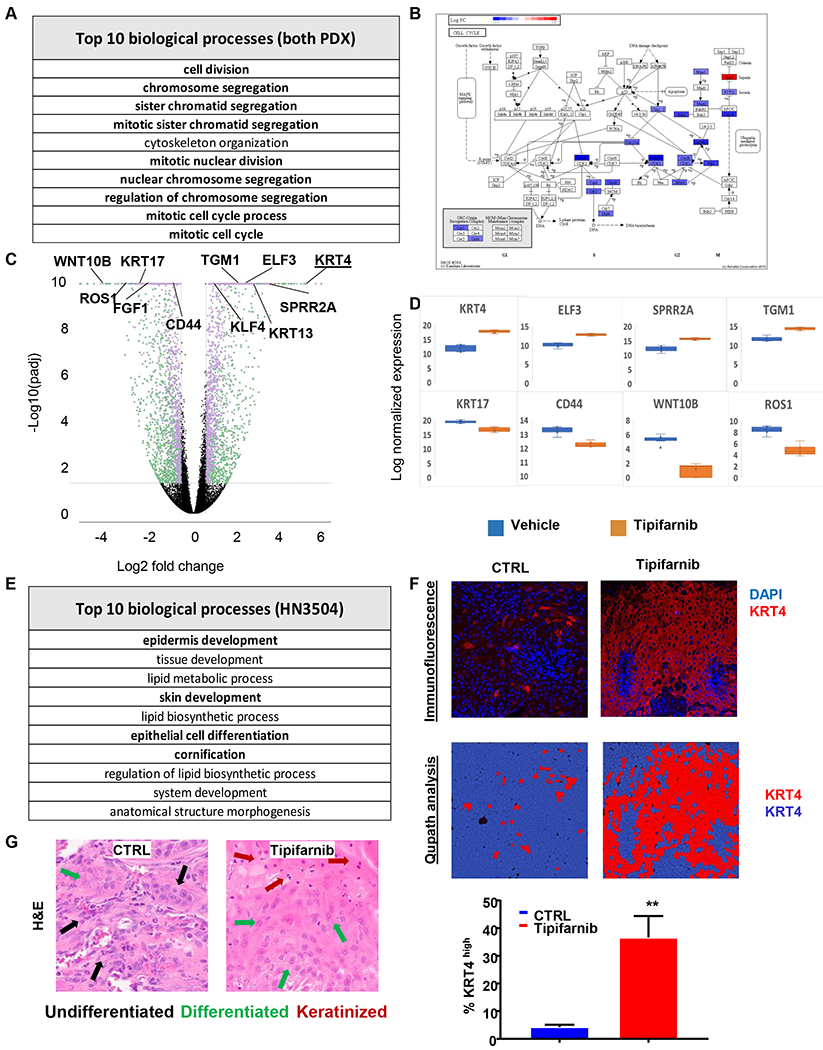
Figure 7. Bioinformatics analysis of tipifarnib activity in PDX models.

(A) Geneset enrichment analysis of top processes altered by tipifarnib treatment in the combined dataset of HN2579 and HN3504 xenografts. (B) Advaita pathway diagram illustrating the roles of genes suppressed by tipifarnib treatment in G2 and M phases of the cell cycle. (C) Volcano plot of differentially expressed (DE) genes in tipifarnib-treated HN3504 tumors (n = 3794, fold change ≥ 1.5, p-Adj < 0.05). Green: less abundant transcripts, purple: more abundant transcripts. (D) Box-and-whisker plots of representative highly DE genes in tipifarnib-treated HN3504 tumors. Upregulated genes: KRT4 (fold change 35.33, p-Adj 1.01e-54), ELF3 (fold change 6.31, p-Adj 2.41e-37), SPRR2A (fold change 8.97, p-Adj 3.52e-27), TGM1 (fold change 6.16, p-Adj 4.37e-28). Downregulated genes: KRT17 (fold change −5.76, p-Adj 2.75e-20), CD44 (fold change −2.02, p-Adj 2.49e-14), ROS1 (fold change −8.86, p-Adj 4.98e-21), WNT10B (fold change −17.10, p-Adj 9.74e-22). (E) Geneset enrichment analysis of top processes altered by tipifarnib treatment in HN3504 xenografts. (F) Immunofluorescence (upper panel) and quantification analysis using Qupath software (bottom panel) of KRT4 expression in control and tipifarnib-treated HN3504 PDX-tumors. (G) H&E highlighting morphologic evidence of squamous differentiation in control and tipifarnib-treated HN3504 PDX-tumors. BALB/c nu/nu mice were inoculated subcutaneously with 2-3 mm tumors fragments, the PDX were allowed to establish to 250-350 mm3, the animals were randomized into groups of three and treated orally with vehicle or tipifarnib (60mg/kg BID) for approximately 20 days.
