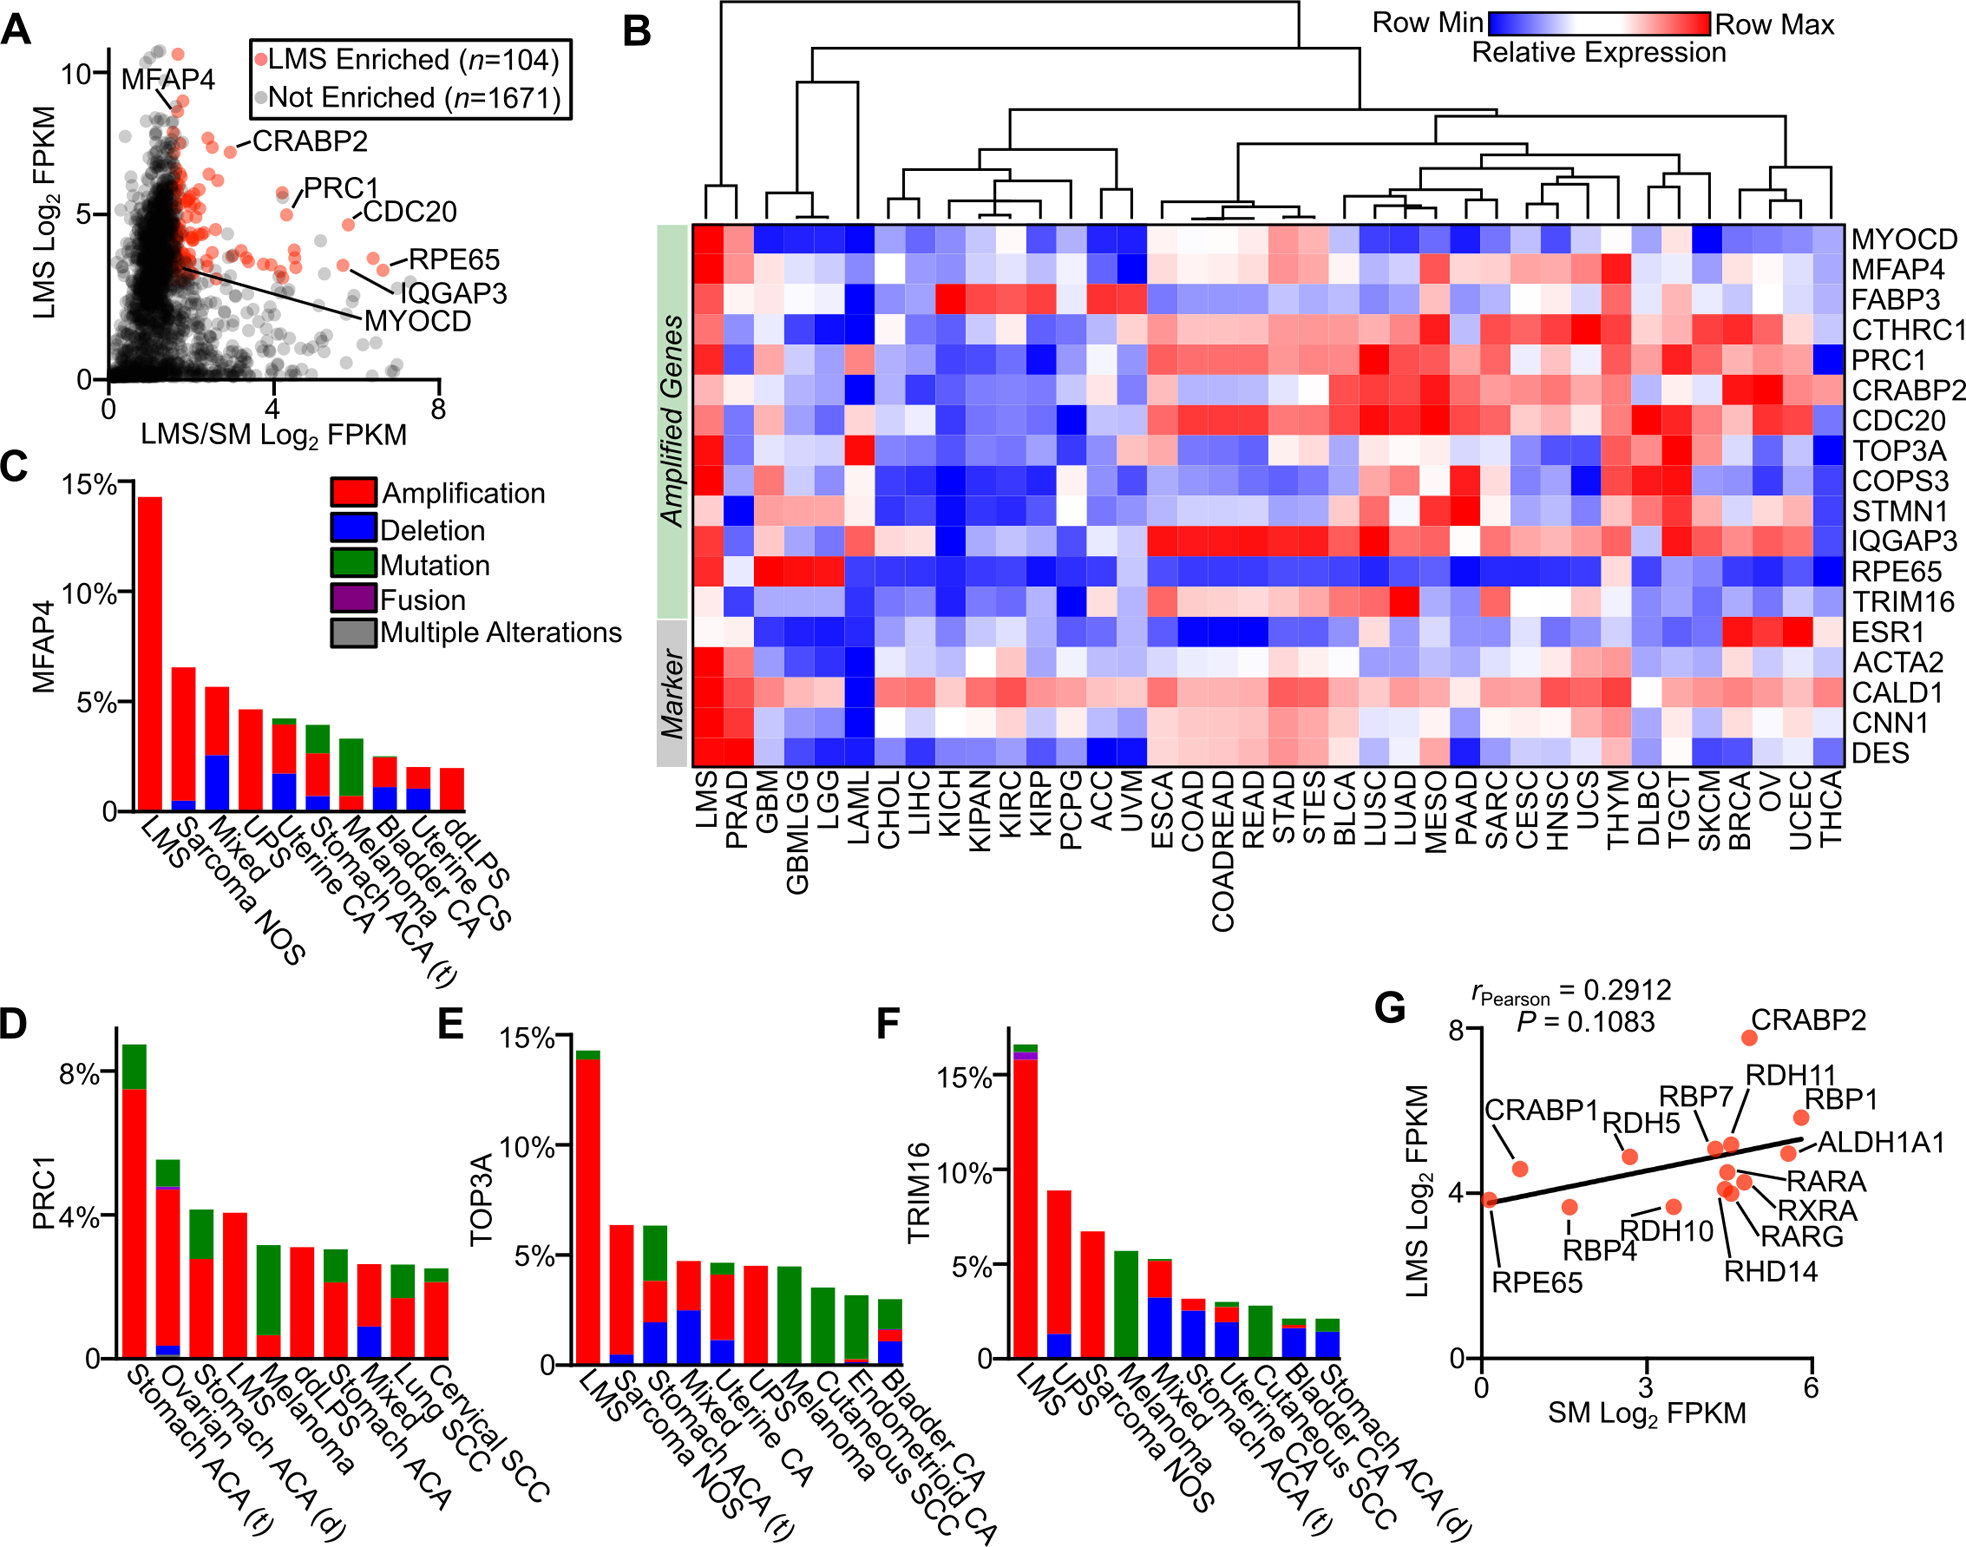
Figure 3.

Gene amplification and expression in LMS. A, Plot of LMS log2 FPKM RNA-seq expression versus the log2 ratio of LMS (n=147) to smooth muscle (n=170) FPKM for genes in recurrently amplified regions in LMS. B, Heatmap with unsupervised hierarchical clustering of select amplified genes and standard histologic markers for LMS in TCGA data sets (Table S1). C-F, Frequency of MFAP4, PRC1, TOP3A and TRIM16 alterations across cancer subtypes in cBioPortal, with the top ten most altered cancer subtypes shown (Table S2). G, Plot of expression in FPKM of select components of the retinoic acid signaling pathway in LMS and normal smooth muscle. The Pearson correlation coefficient is shown.
