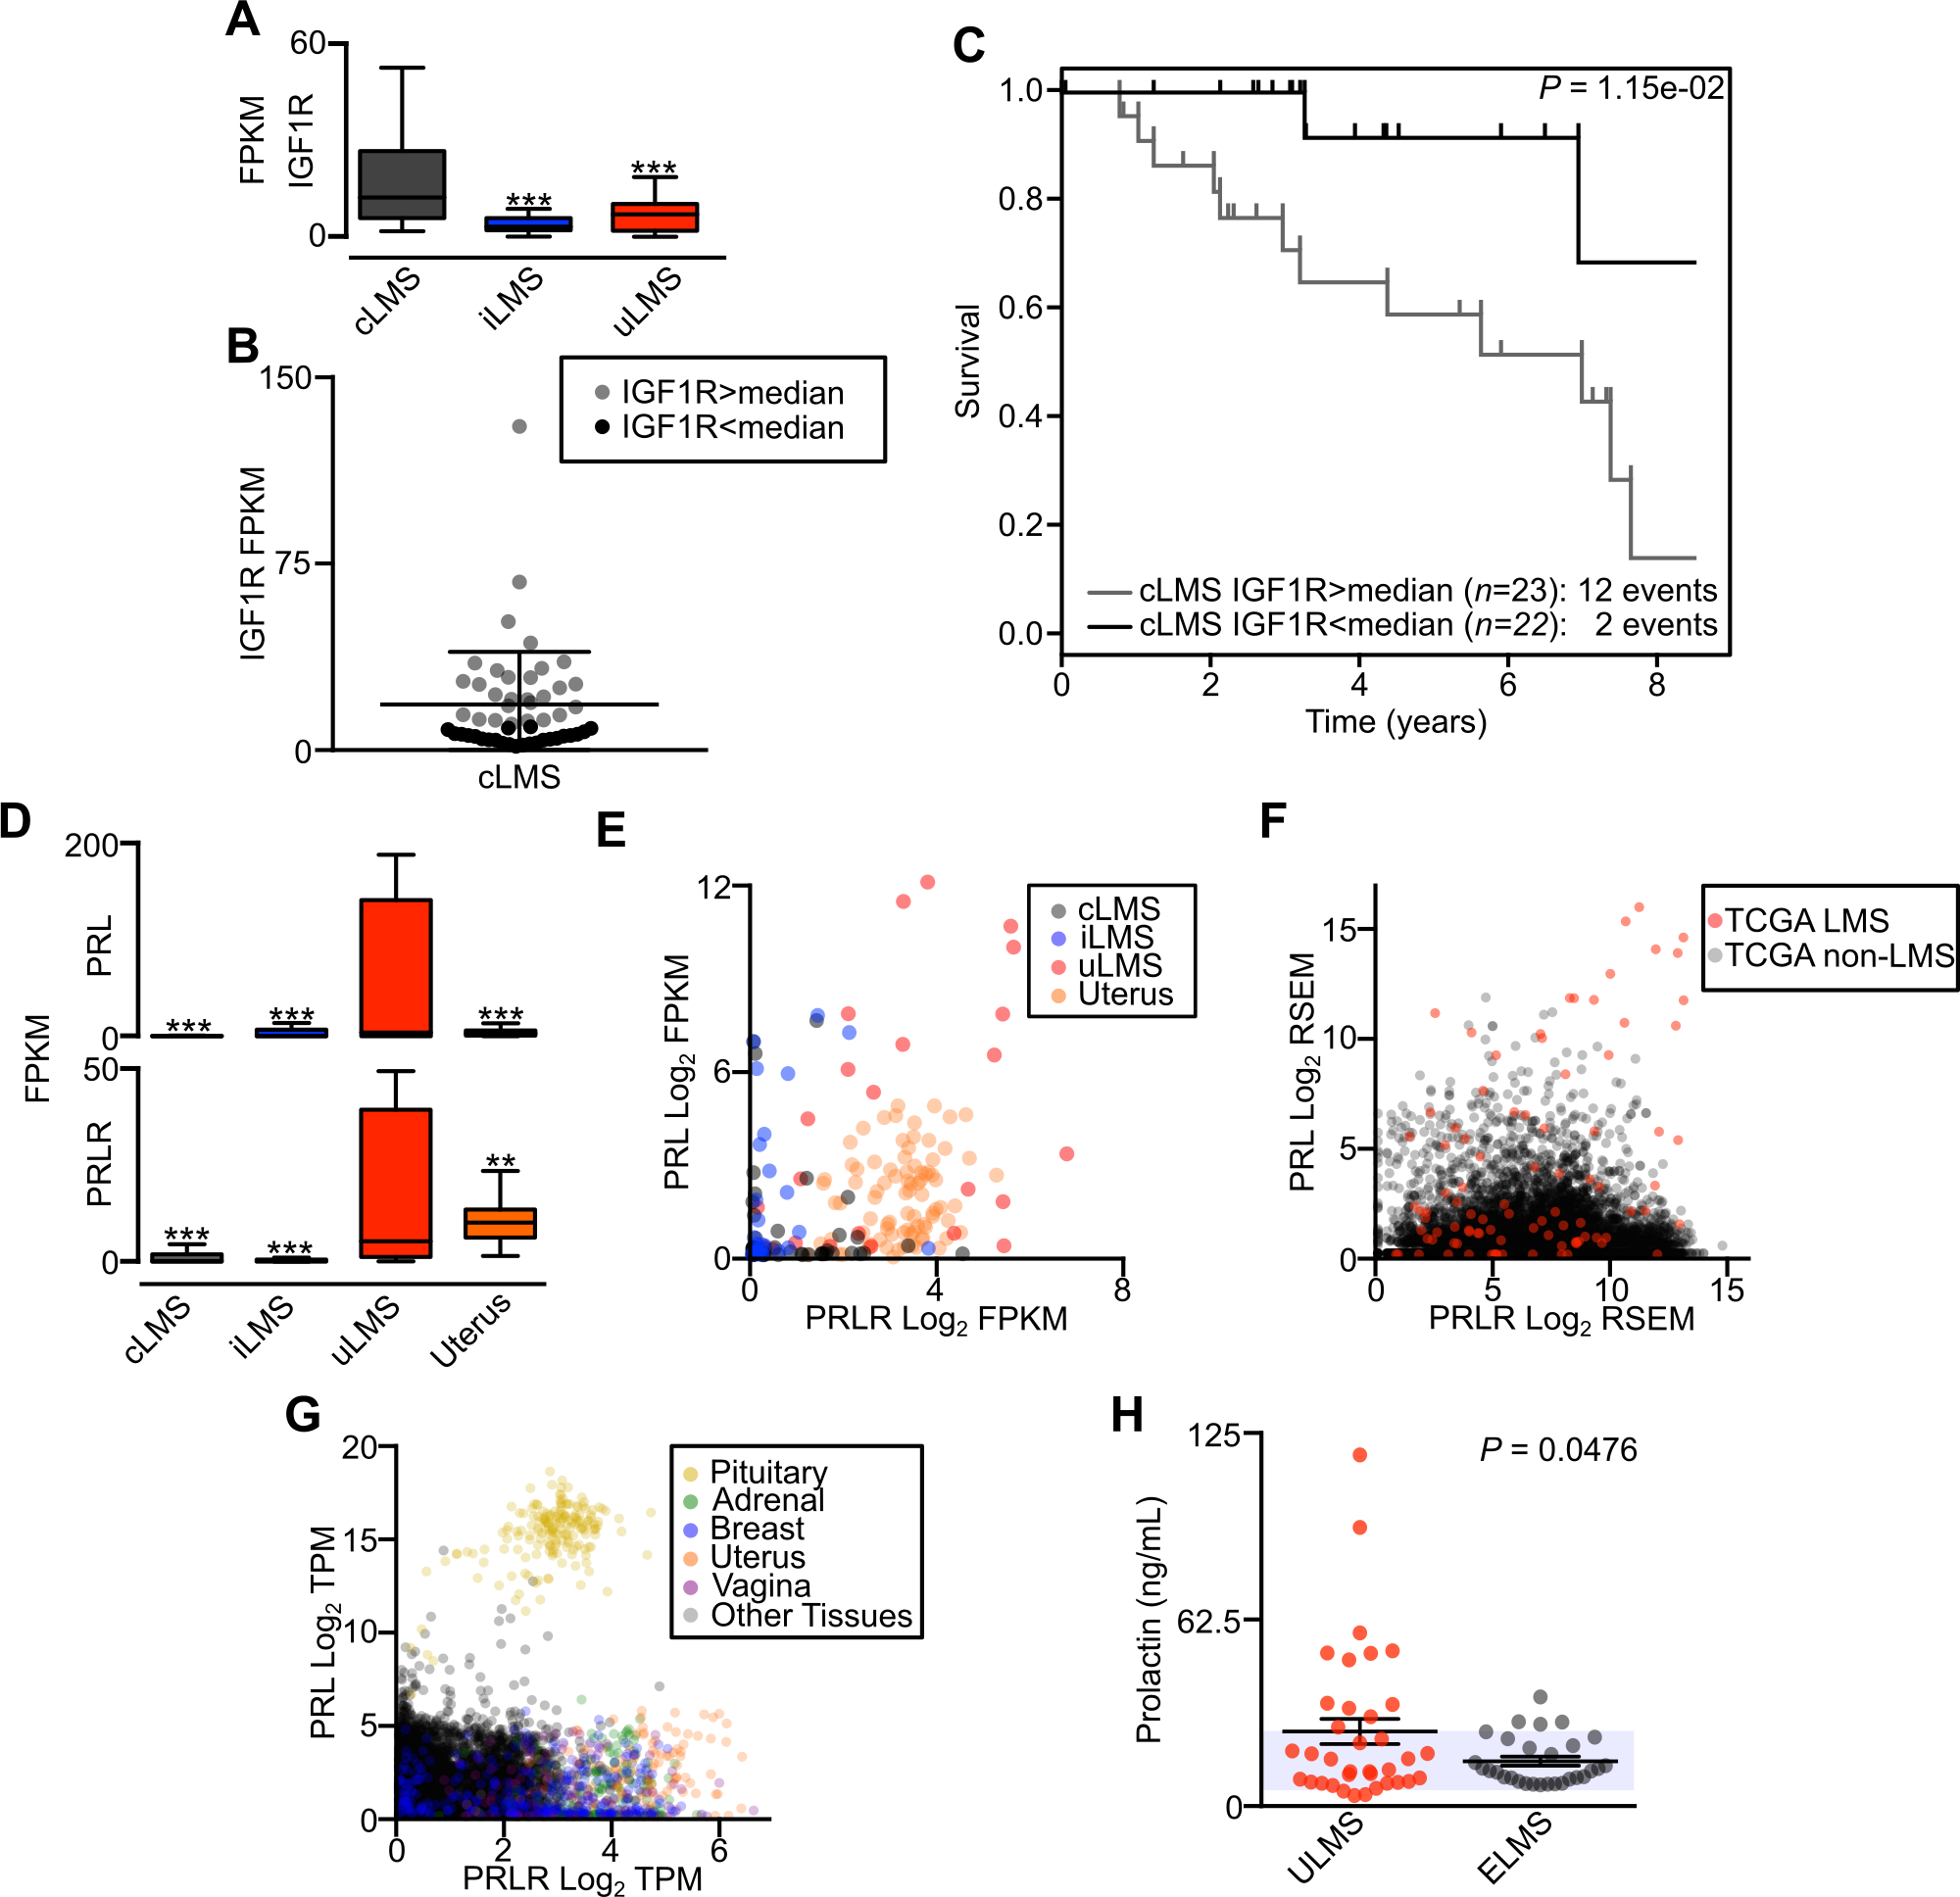
Figure 6.

LMS subtype-specific oncogene-associated pathways. A, Box plot displaying FPKM of IGF1R between LMS subtypes (cLMS n=52, iLMS n=30, uLMS n=25). B, IGF1R expression level in cLMS samples, with color differentiating samples above and below the median value. C, Kaplan-Meier analysis of disease-specific survival comparing cLMS stratified by IGF1R expression above or below the median. Survival data were analyzed by log-rank test. D, Box plot displaying FPKM of PRL (top) and PRLR (bottom) between LMS subtypes. Data were analyzed by one-way ANOVA with Tukey’s post-hoc test (compared to the indicated LMS subtype; **, P<0.01; ***, P<0.001). E, Log2 FPKM scatterplot of PRL and PRLR comparing LMS subtypes and normal uterus (n=85). F, Scatterplot of PRL and PRLR log2 RSEM in all TCGA tumors (n=14,114). LMS tumors are indicated in red. G, Scatterplot of PRL and PRLR log2 TPM in GTEx normal tissues (n=10,788). Select tissues are differentiated by color. H, ELISA of serum prolactin levels in patients with metastatic ULMS (n=36) or ELMS (n=29). The shaded area indicates reference values for normal female prolactin levels; P -value indicates unpaired t-test.
