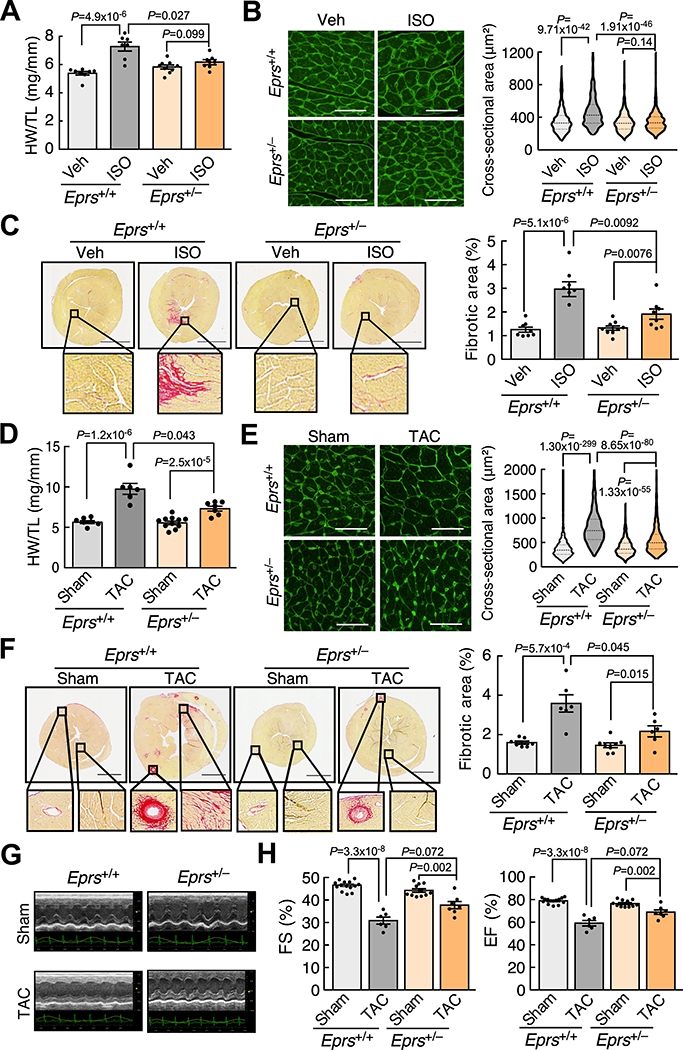
Figure 2. Eprs haploinsufficiency attenuates cardiac hypertrophy and fibrosis in ISO infusion and TAC models.
(A) Eprs+/– mice show a reduced HW/TL (heart weight/tibia length) ratio in a 4-week ISO infusion mouse HF model compared to WT (Eprs+/+) mice. n=8/ 7/ 9/ 8 for Eprs+/+ Veh/ Eprs+/+ ISO/ Eprs+/– Veh/ Eprs+/– ISO, respectively.
(B) WGA staining of Eprs+/+ and Eprs+/– mice with ISO treatment. Cross-sectional area (CSA) of CMs was measured and quantified. n=4 hearts per group with 200–300 CMs measured per heart. Scale bar: 50 μm.
(C) Picrosirius red staining indicates decreased fibrotic area in the hearts from Eprs+/– mice after ISO infusion. Scale bar: 2 mm. n=8/ 7/ 9/ 8 for Eprs+/+ Veh/ Eprs+/+ ISO/ Eprs+/– Veh/ Eprs+/– ISO, respectively.
(D) Single allele knockout of Eprs reduces HW/TL ratios in a TAC surgery-induced mouse HF model. n=7/ 6/ 11/ 7 for Eprs+/+ Sham/ Eprs+/+ TAC/ Eprs+/– Sham/ Eprs+/– TAC, respectively.
(E) WGA staining in Eprs+/+ and Eprs+/– mice with TAC surgery. n=4 hearts per group with 200–300 CMs measured per heart. Scale bar: 50 μm.
(F) Single allele knockout of Eprs reduces cardiac fibrosis in TAC surgery model. n=7/ 6/ 8/ 6 for quantification of picrosirius red staining for Eprs+/+ Sham/ Eprs+/+ TAC/ Eprs+/– Sham/ Eprs+/– TAC, respectively. Scale bar: 2 mm.
(G) Representative echocardiographic images suggest improved cardiac function in Eprs+/– mice compared to WT mice after TAC surgery.
(H) Fractional shortening (FS) and ejection fraction (EF) are partially recovered in Eprs+/– mice in TAC surgery-induced mouse HF model. n=14/ 6/ 11/ 7 for Eprs+/+ Sham/ Eprs+/+ TAC/ Eprs+/– Sham/ Eprs+/– TAC, respectively.
Comparisons were performed by non-parametric Kruskal-Wallis test with Conover-Iman method for post hoc pairwise comparisons and Benjamini-Hochberg correction for A-F, H.

