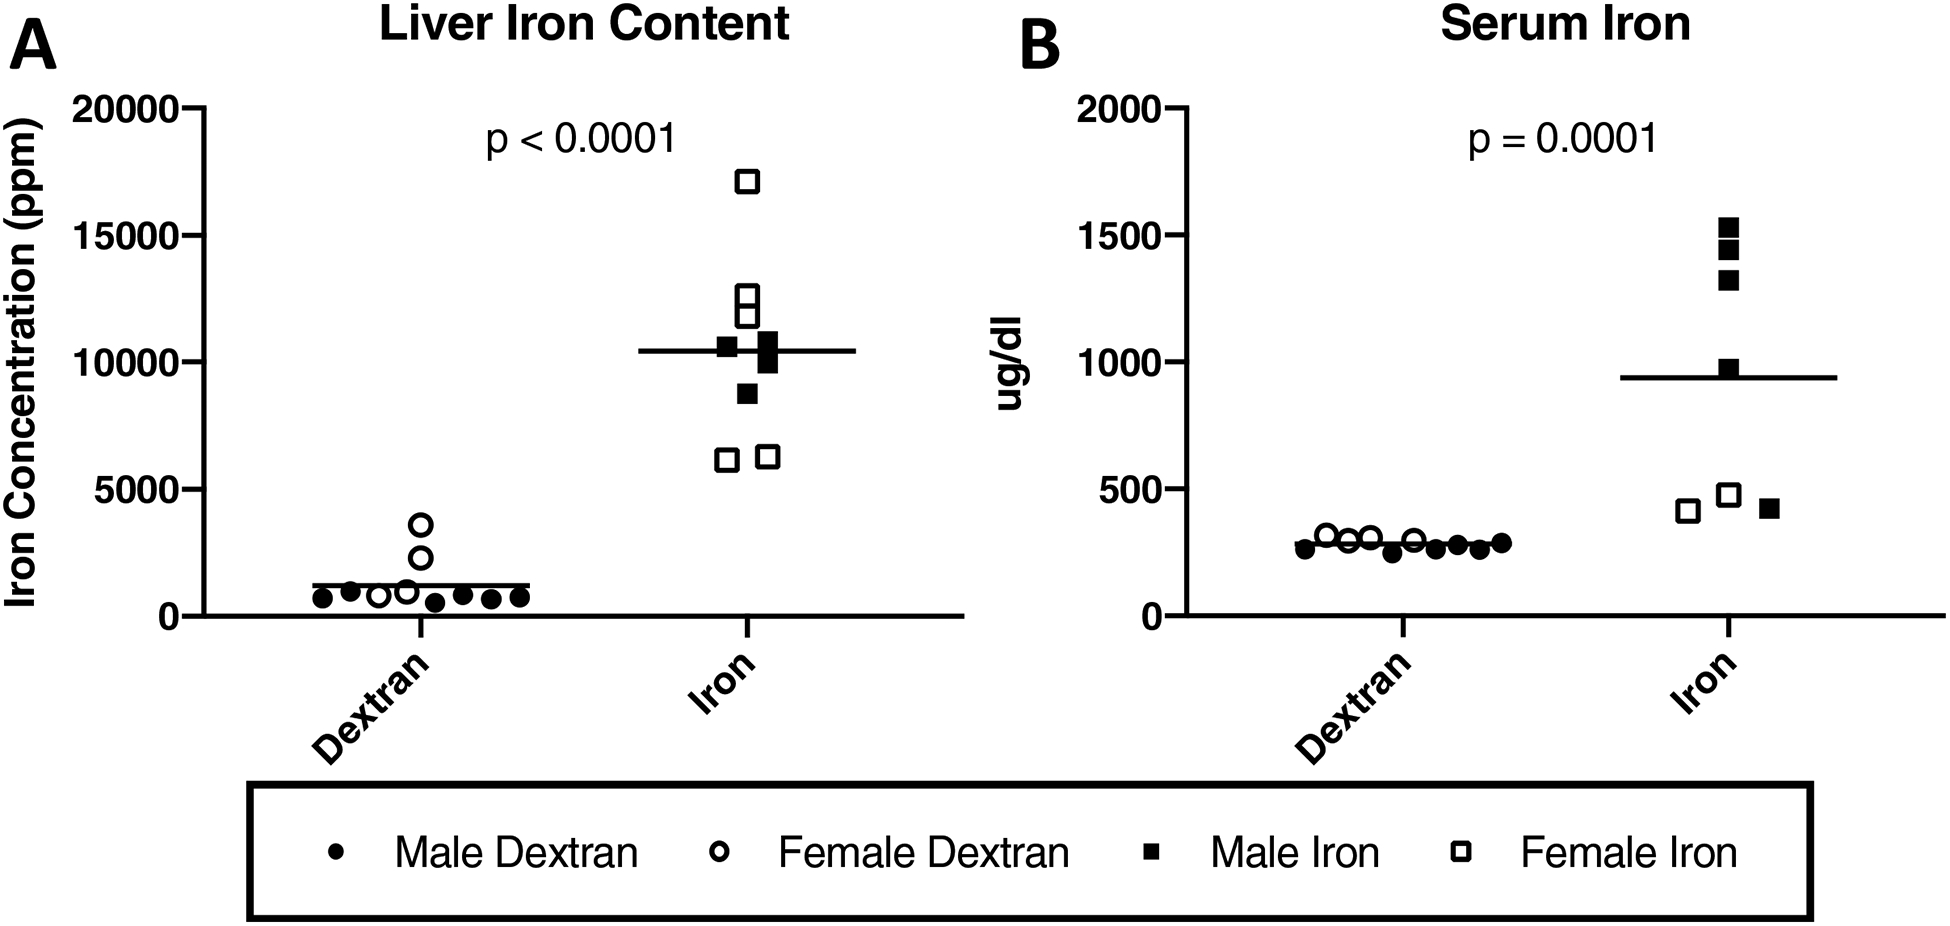
Figure 1.

Systemic iron quantification. Black lines on graphs indicate mean values. [A] Liver iron concentrations determined by iron AAS×. Livers from animals in the iron overload group had a mean iron concentration of 10,448.00 ppm (n = 9). Livers from animals in the dextran control group had a mean iron concentration of 1,214.00 ppm (n = 10; 9,777.00 ppm difference between medians). One animal from the iron overload group was unable to be included in liver iron analysis due to lack of available tissue. [B] Serum iron concentration×. Mean serum iron concentration was 939.10 μg/dl in iron overloaded animals (n = 7) and was 281.90 μg/dl in dextran control animals (n = 10; 689.50 μg/dl difference between medians). Serum was unable to be collected from 2 animals in the iron overload group and, as such, these animals were not included in this analysis. Additionally, 1 serum sample from an iron overload animal was identified for preanalytical sample preclusion due to hemolyzed serum. As serum iron measurement can be influenced by hemolysis during blood collection, the hemolyzed sample was excluded from serum iron analysis (n = 7). Data with non-Gaussian distribution were compared using non-parametric Mann-Whitney tests×. No significant sex differences were present for liver iron concentration or serum iron concentration.
