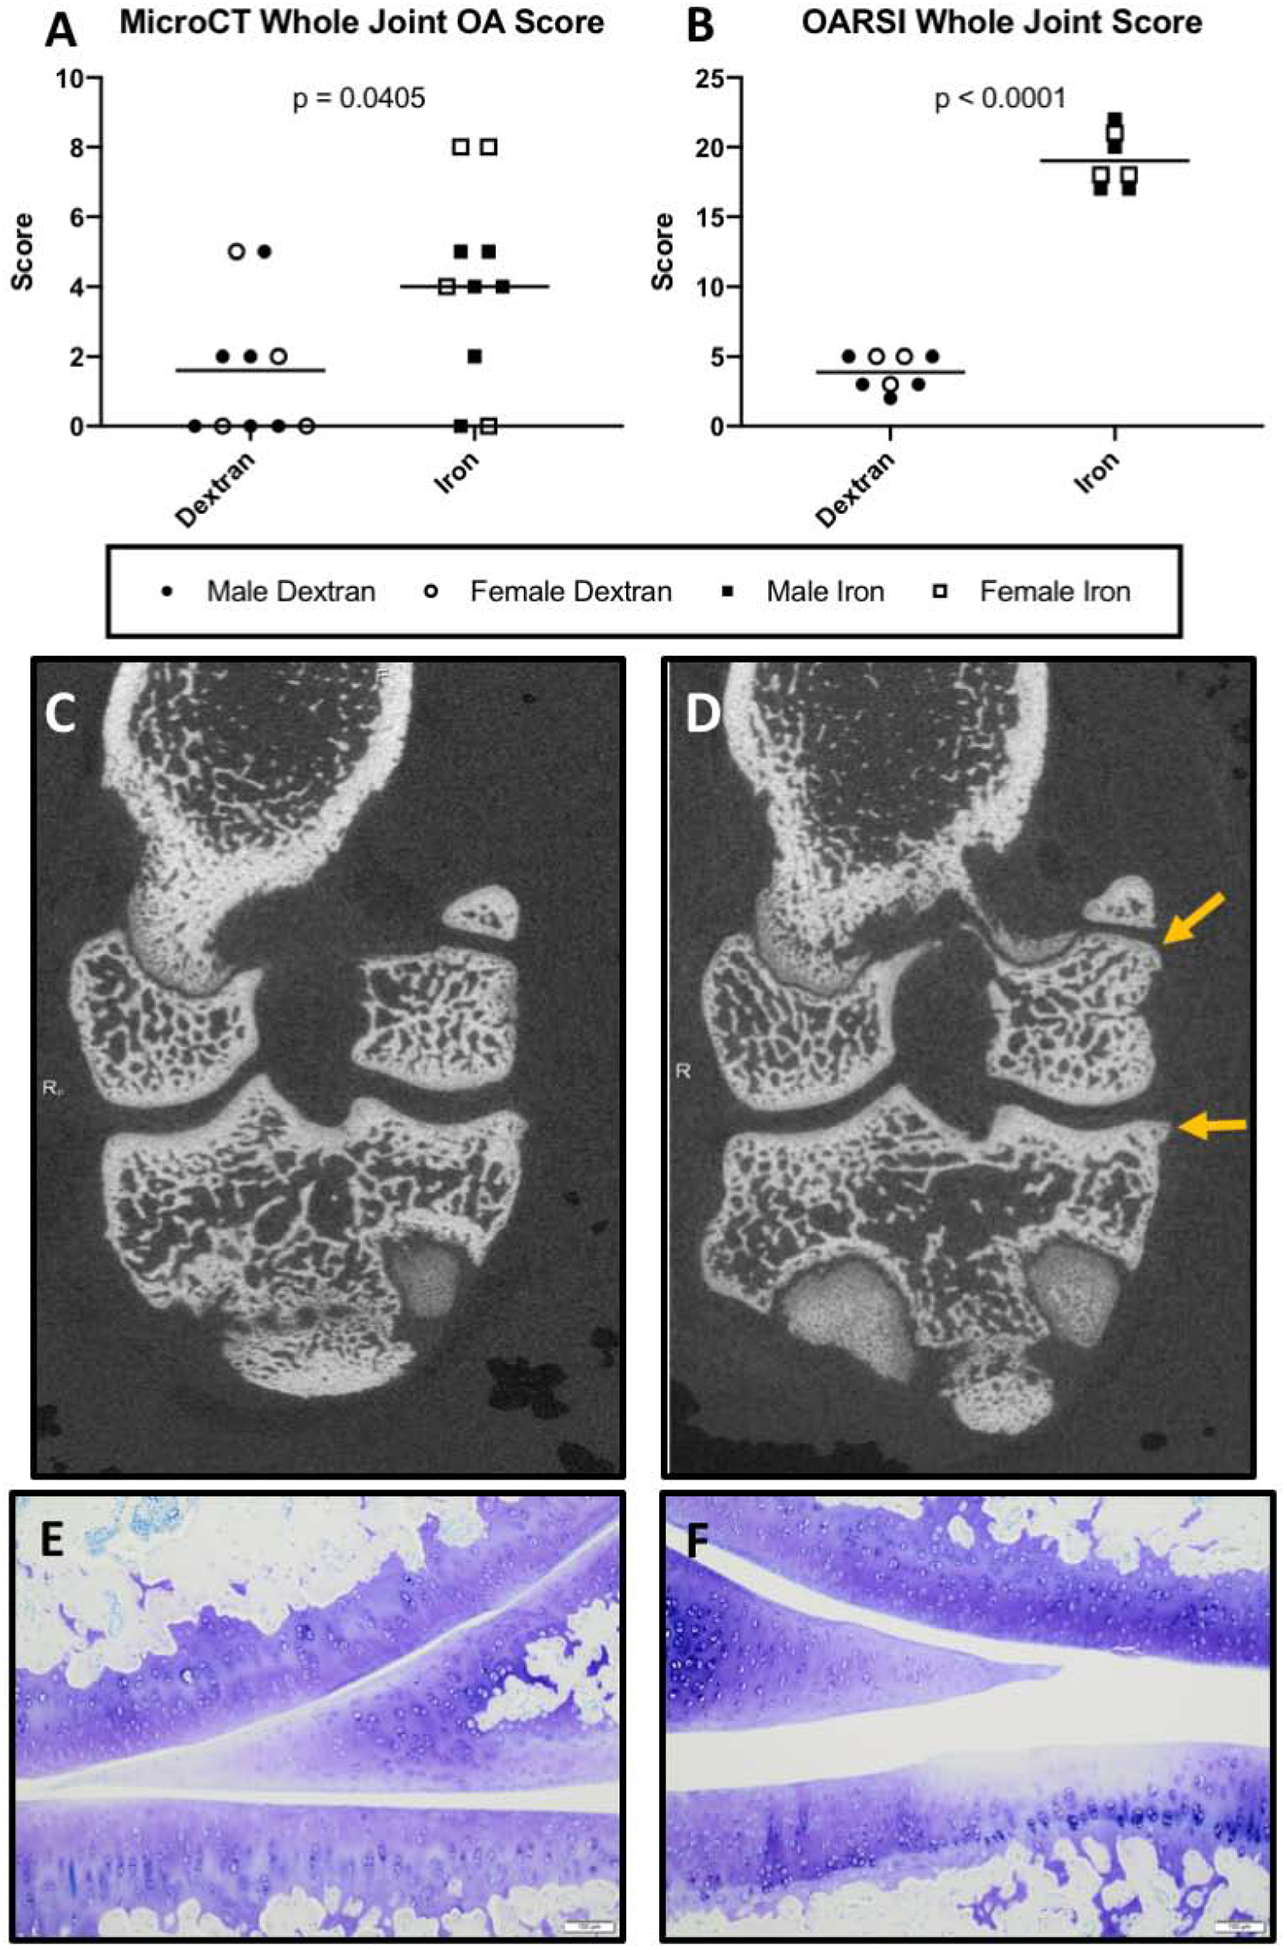
Figure 3.

Structural analysis of knee joints. Black lines on graphs represent mean values. [A] Mean whole joint microCT score† was 4.00 in iron overloaded animals (n = 10) compared to 1.60 in dextran control animals (n = 10; 95% CI 0.12 – 4.68). Whole joint microCT score was determined by analyzing radiographic changes typically used in evaluating human OA, such as the presence and location of osteophytes, subchondral bone changes, and articular bone lysis22. [B] Mean whole joint OARSI score† was 19.00 in iron overloaded animals (n = 7) and 3.875 in dextran control animals (n = 8; 95% CI 13.29 – 16.96) (possible range of scores 0 – 84). Five animals (3 from the iron overload group and 2 from the dextran control group) were unable to be evaluated for whole joint OARSI histologic grading due to appropriate tissue sections being unavailable. [C-D] Representative microCT images of [C] a control knee joint with minimal to no radiographic evidence of OA and [D] a knee joint from the iron overload group. Arrows indicate an irregular surface with an enthesophyte forming on the femur and another, more prominent osteophyte on the tibia. [E-F] Photomicrographs of Toluidine blue stained sections from medial compartments of knee joints. [E] Representative image from the control group with a relatively smooth articular cartilage surface, minimal proteoglycan loss, and expected cellularity. [F] Representative image from the iron overload group, which displays a disrupted articular cartilage surface on the tibia and some focal loss of proteoglycans (as evidenced by lighter staining), with chondrocyte loss observed in the same area. Normally distributed data with similar variance were compared using parametric t tests†. No significant sex differences were present for total joint microCT score and total joint OARSI score.
