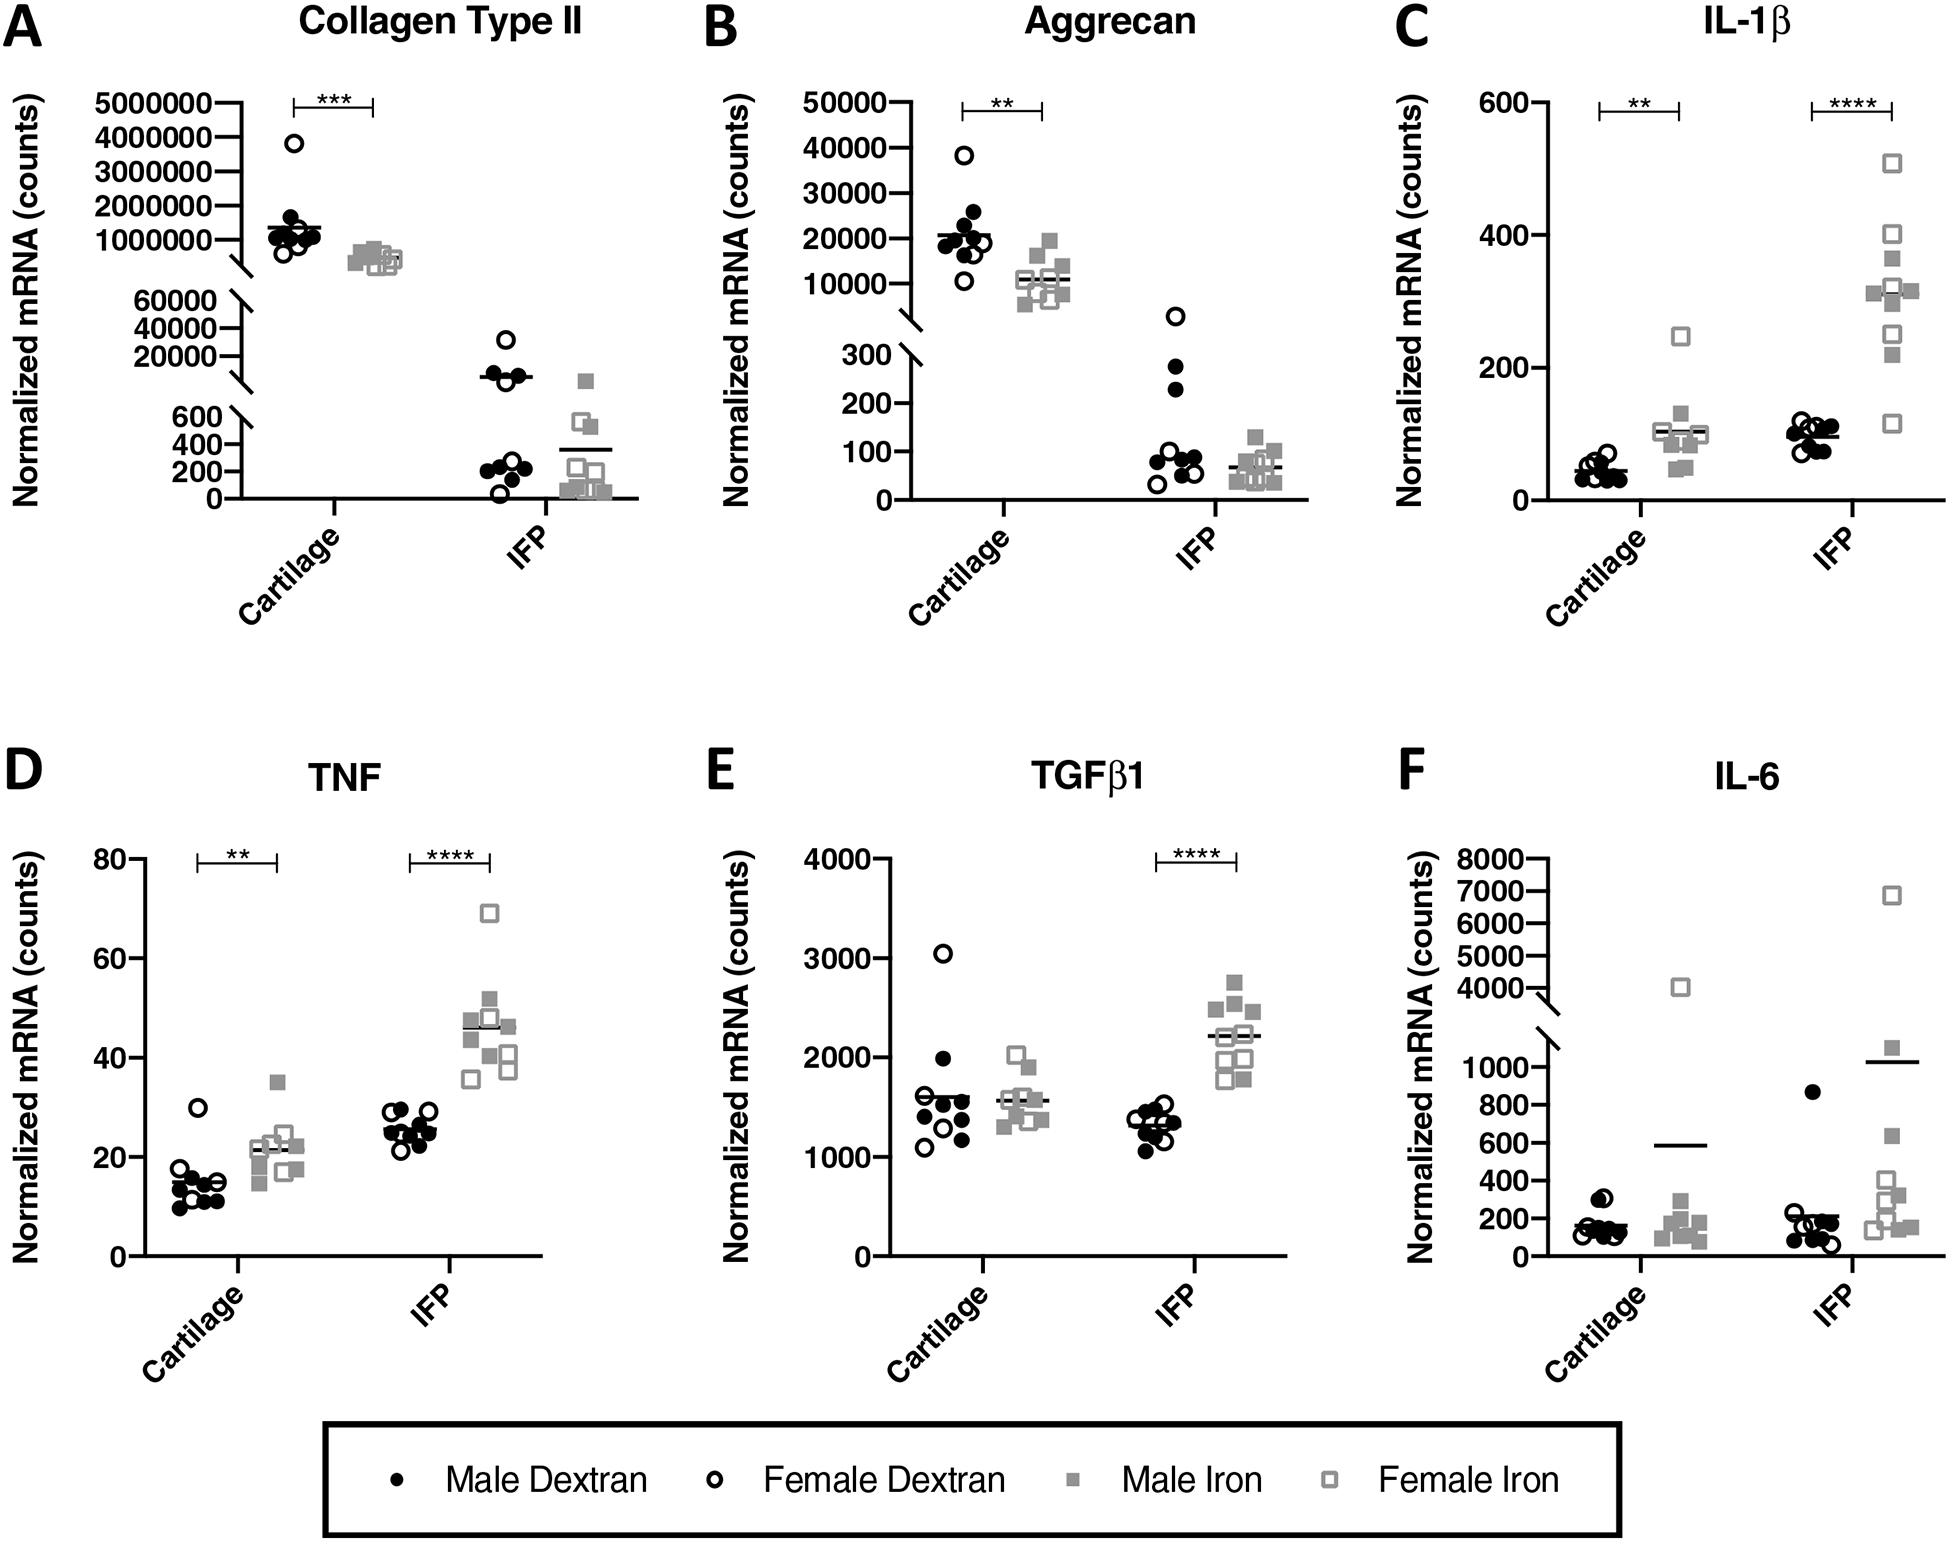
Figure 5.

Normalized mRNA counts for select genes in articular cartilage and the IFP. Black lines on graphs represent mean values. [A] collagen type II× [B] aggrecan†× [C] IL-1β× [D] TNF× [E] IL-6× and [F] TGFß1×◊. One cartilage sample from an animal in the iron overload group did not pass initial quality control for the assay and, as a result, was not analyzed for mRNA expression. As such, the number of animals from the iron overload group for cartilage gene expression analysis was 9, while all other gene expression analyses included 10 animals per group. Normally distributed data with similar variance were compared using parametric t tests†. Normally distributed data with significant differences in variance were compared using parametric t tests with Welch’s correction◊. Data with non-Gaussian distribution were compared using non-parametric Mann-Whitney tests×. No significant sex differences were present for the genes analyzed.
