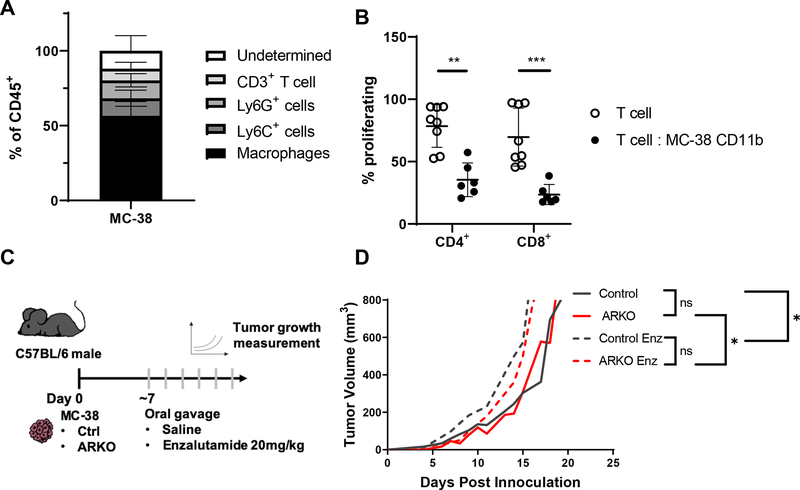
Figure 1. AR inhibition accelerated MC-38 colon tumor growth.
(A, B) Eight- to twelve-week old C57BL/6 males were injected subcutaneously on the shoulder with 106 MC-38 colon tumor cells. Analyses were done when tumors reached 1000mm3. Graphs show pooled data of 2 experiments with 3 mice per group per experiment and show mean and standard deviation. (A) Percentage of tumor infiltrating leukocyte populations within CD45+ cells determined by flow cytometry. CD11b+ cells from tumors were isolated and measured for suppressive activity in vitro. Graph depicts (B) proliferation of CD4+ and CD8+ T cells cocultured with tumor-infiltrating CD11b+ cells, analyzed with Man-Whitney test. (C) C57BL/6 males were injected subcutaneously on the shoulder with 106 MC-38 control or MC-38 ARKO colon tumor cells and given saline or enzalutamide 20mg/kg daily by oral gavage when tumors reached 100mm3. (D) Tumor growth curve is depicted with pooled data of 2 experiments with 5 mice per group analyzed with random mixed model. Mean tumor size vs. time is shown. Black lines indicate MC-38 control, red lines indicate MC-38 ARKO, and dashed lines indicate enzalutamide treatment. * p<0.05, **p<0.01 and ***p<0.001.

