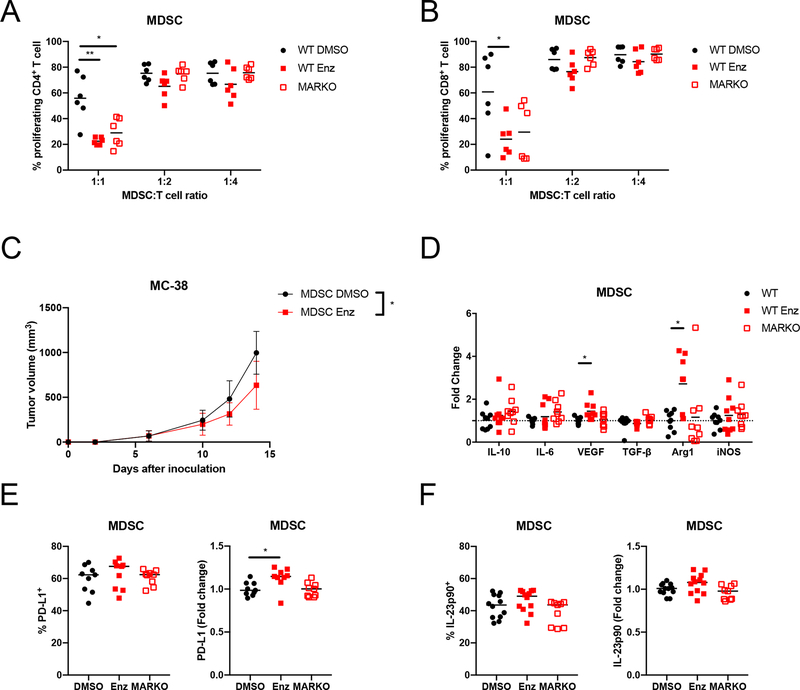
Figure 3. AR inhibition enhanced MDSC immunosuppression.
(A-B) WT DMSO-treated, WT enzalutamide-treated or MARKO MDSCs were cocultured with CTV-stained anti-CD3/CD28 stimulated CD3+ T cells. Graphs depicts results from 2 pooled experiments of 3 biological replicates each and indicate (A) CD4+ and (B) CD8+ T cell proliferation, which indicate MDSC suppressive potential assessed by flow cytometry. (C) DMSO and enzalutamide-treated MDSCs were generated, mixed in a 2:1 ratio with MC-38 tumor cells and injected subcutaneously into B6-SCID males; plot indicates tumor growth (mean and standard deviation) of 2 pooled experiments with 3–5 mice/group per experiment. (D) RNA was extracted from WT DMSO-treated, WT enzalutamide-treated or MARKO MDSCs and gene expression was assessed by qRT-PCR. Graph depicts gene expression fold change relative to WT MDSCs. (E-F) MDSC protein expression was determined by flow cytometry for PD-L1 (E) and IL-23p90 (F). Dotted line indicates fold change of 1. For all graphs, black dots denote WT MDSCs, red solid squares WT enzalutamide MDSCs and red empty squares MARKO MDSCs. Kruskal-Wallis test were first performed for A, B and D. Lines indicate mean and, when noted, error bars indicate standard deviation. Significant comparisons were then compared by Paired or Mann-Whitney tests with corrections. Two-way ANOVA was performed for data shown in C. *p<0.05, **p<0.01.

